MRRProData.quicklook(source="raw")
Time-height quicklook of a RAW two-dimensional field.
uv run python scripts/build_plot_examples.py --only quicklook-raw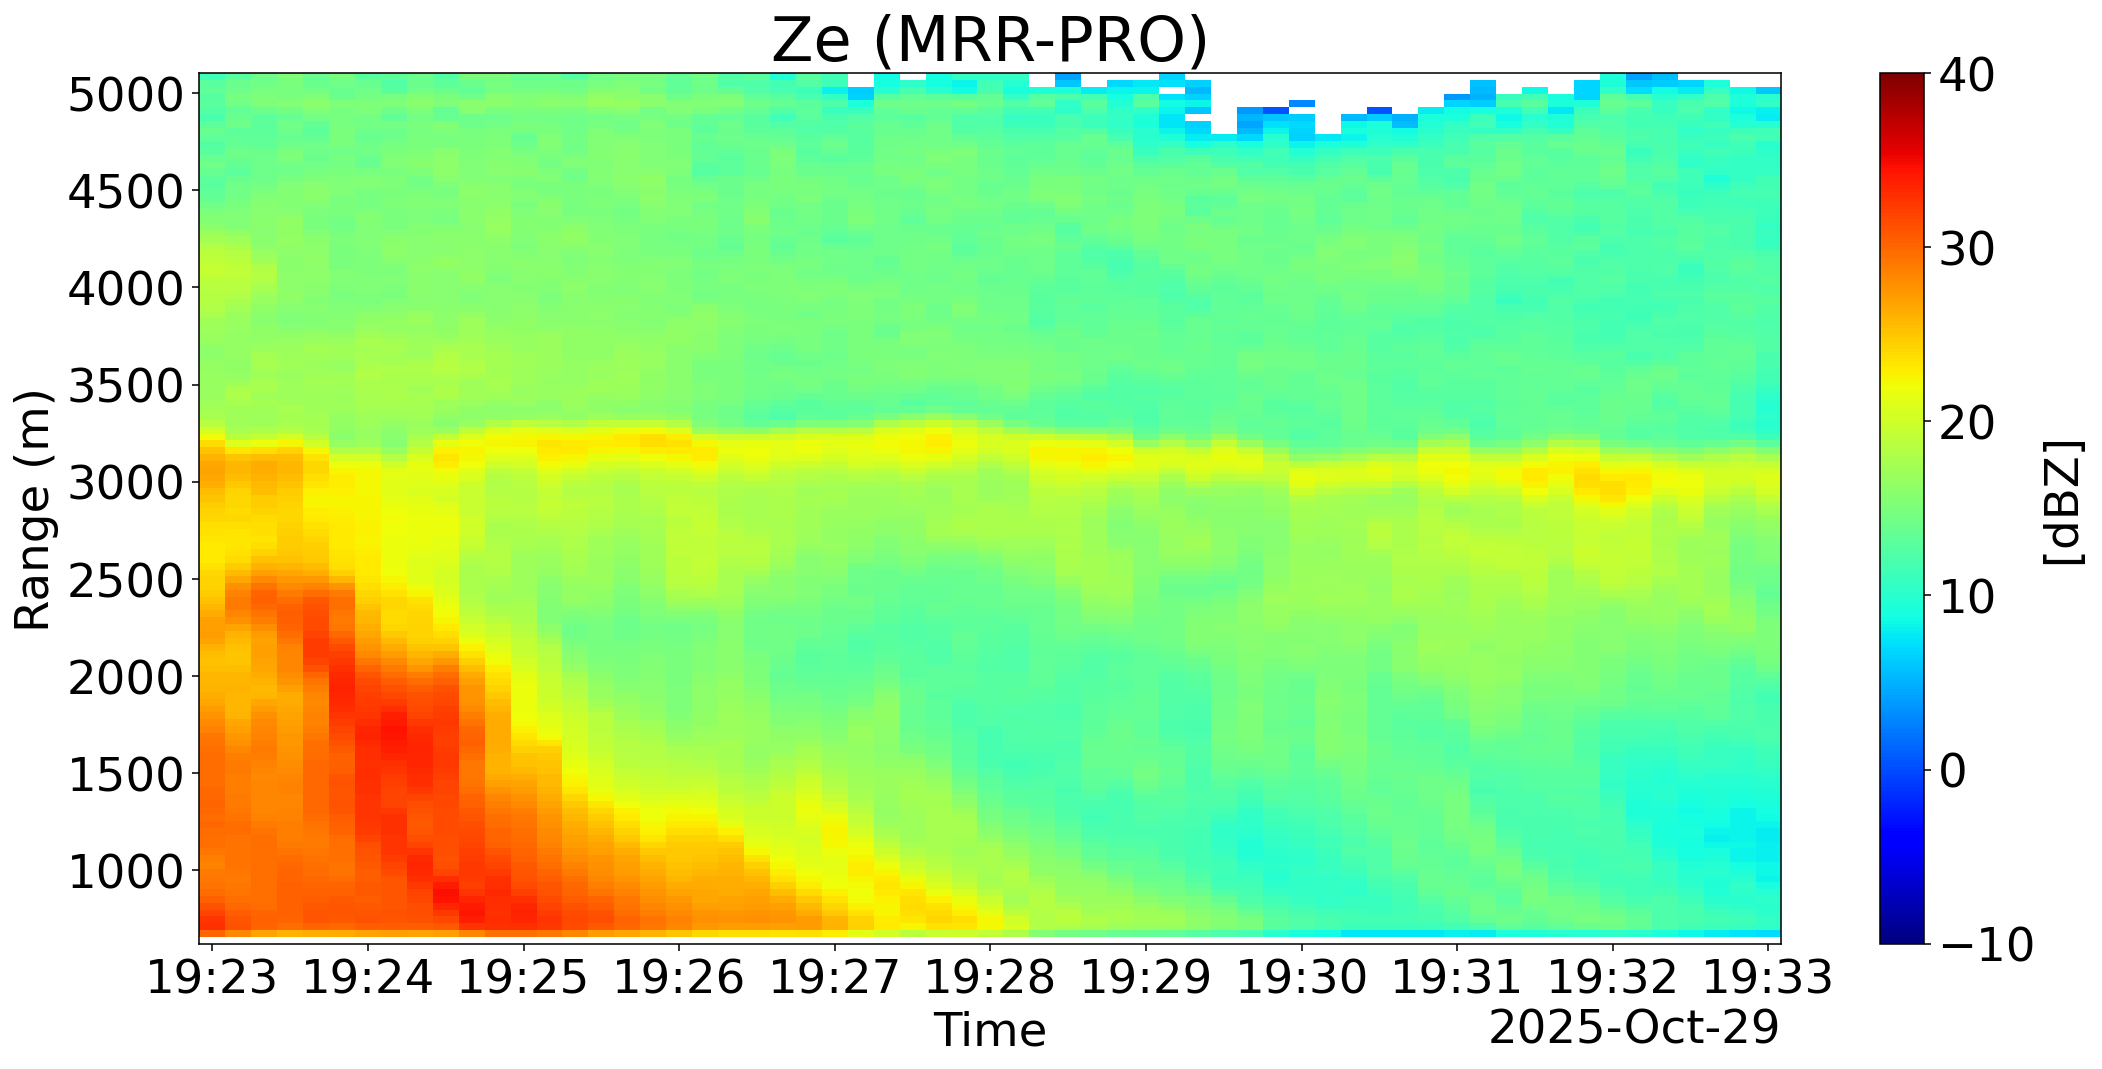
Each example links the plotting method to a reproducible terminal command
and the figure produced by that command. The examples use the small
versioned fixtures under tests/data/.
uv run python scripts/build_plot_examples.py
To regenerate one figure, use the --only command shown in
the corresponding example.
MRRProData.quicklook(source="raw")Time-height quicklook of a RAW two-dimensional field.
uv run python scripts/build_plot_examples.py --only quicklook-rawMRRProData.plot_spectrum()Single-gate Doppler spectrum for one time and range.
uv run python scripts/build_plot_examples.py --only plot-spectrum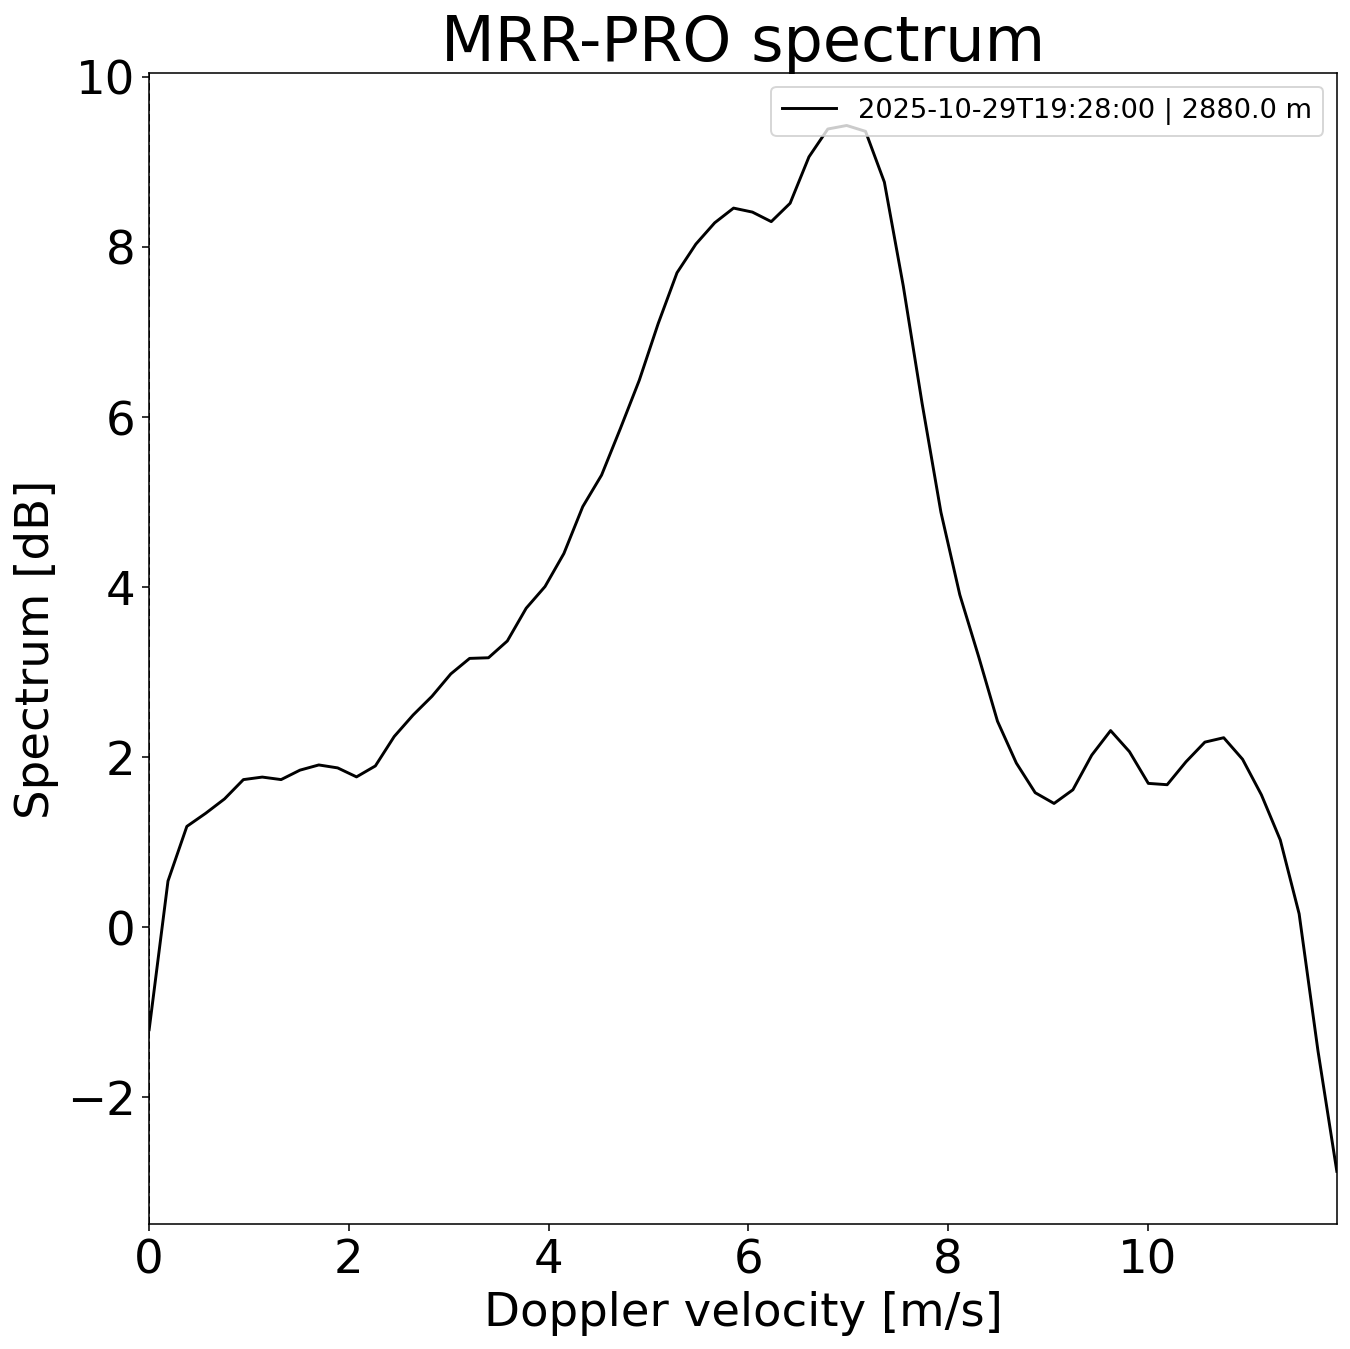
MRRProData.plot_spectra_by_range()Several Doppler spectra at one time, overlaid by range.
uv run python scripts/build_plot_examples.py --only plot-spectra-by-range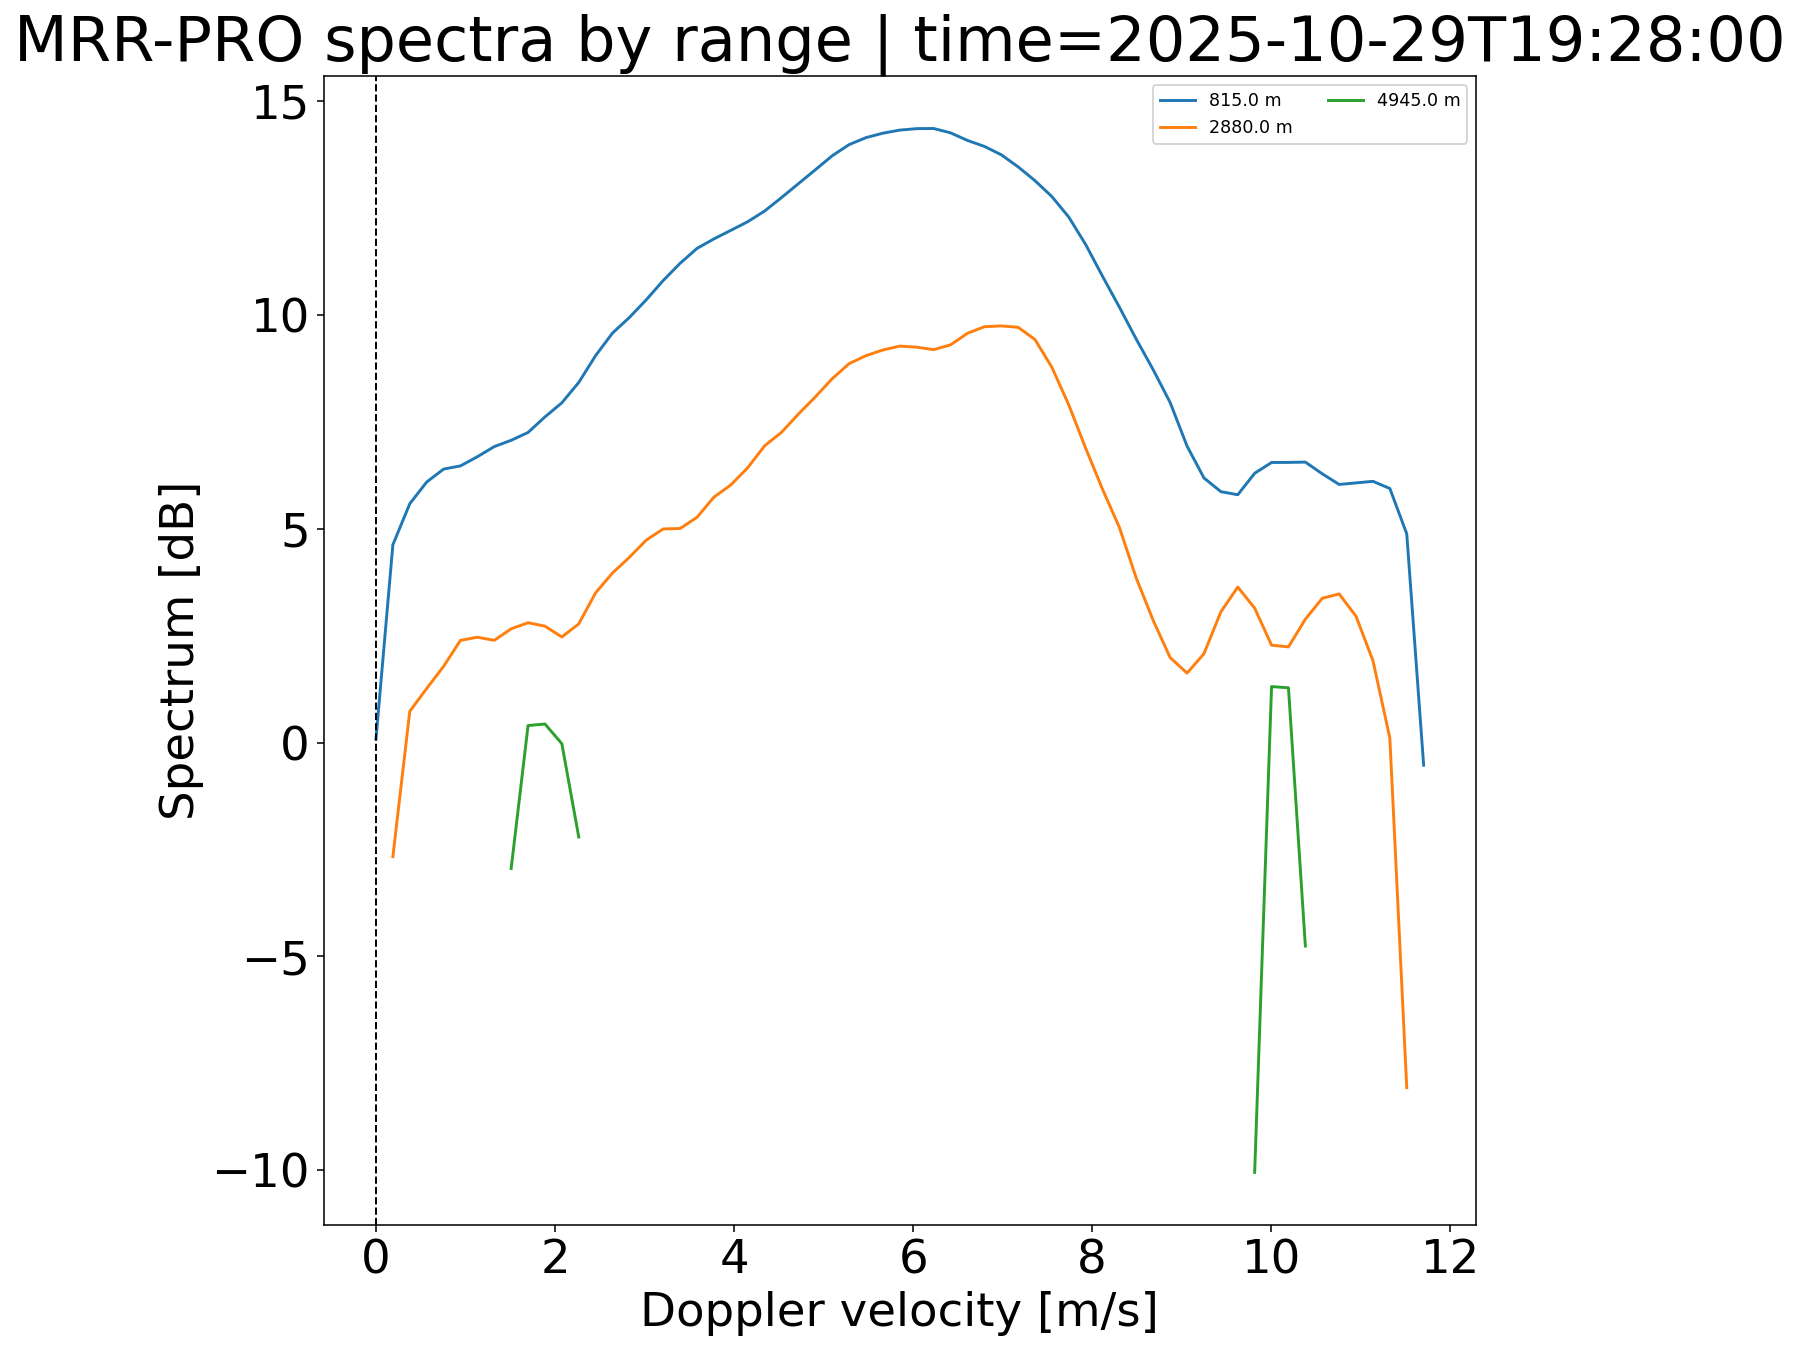
MRRProData.plot_spectrogram(spectrum_var="spectrum_raw")Range-by-Doppler spectrogram from the RAW spectrum.
uv run python scripts/build_plot_examples.py --only plot-spectrogram-raw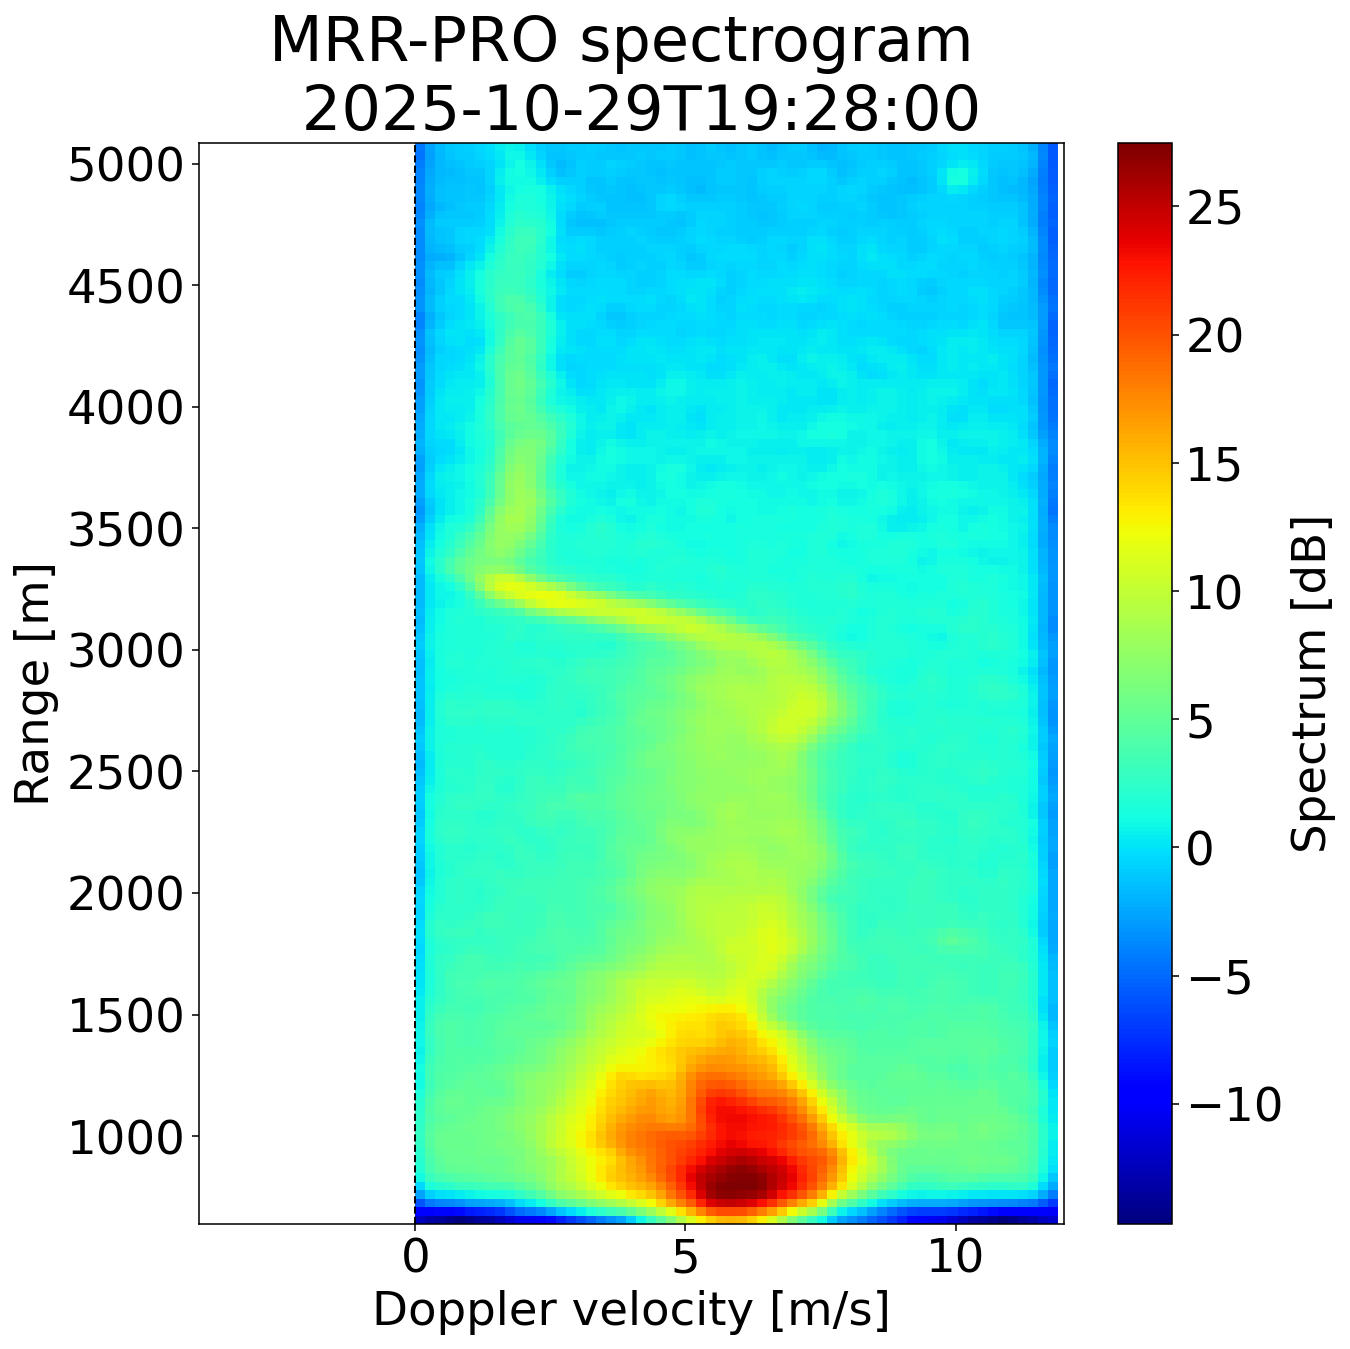
MRRProData.quicklook(source="raprompro")Time-height quicklook of a processed RaProMPro field.
uv run python scripts/build_plot_examples.py --only quicklook-raprompro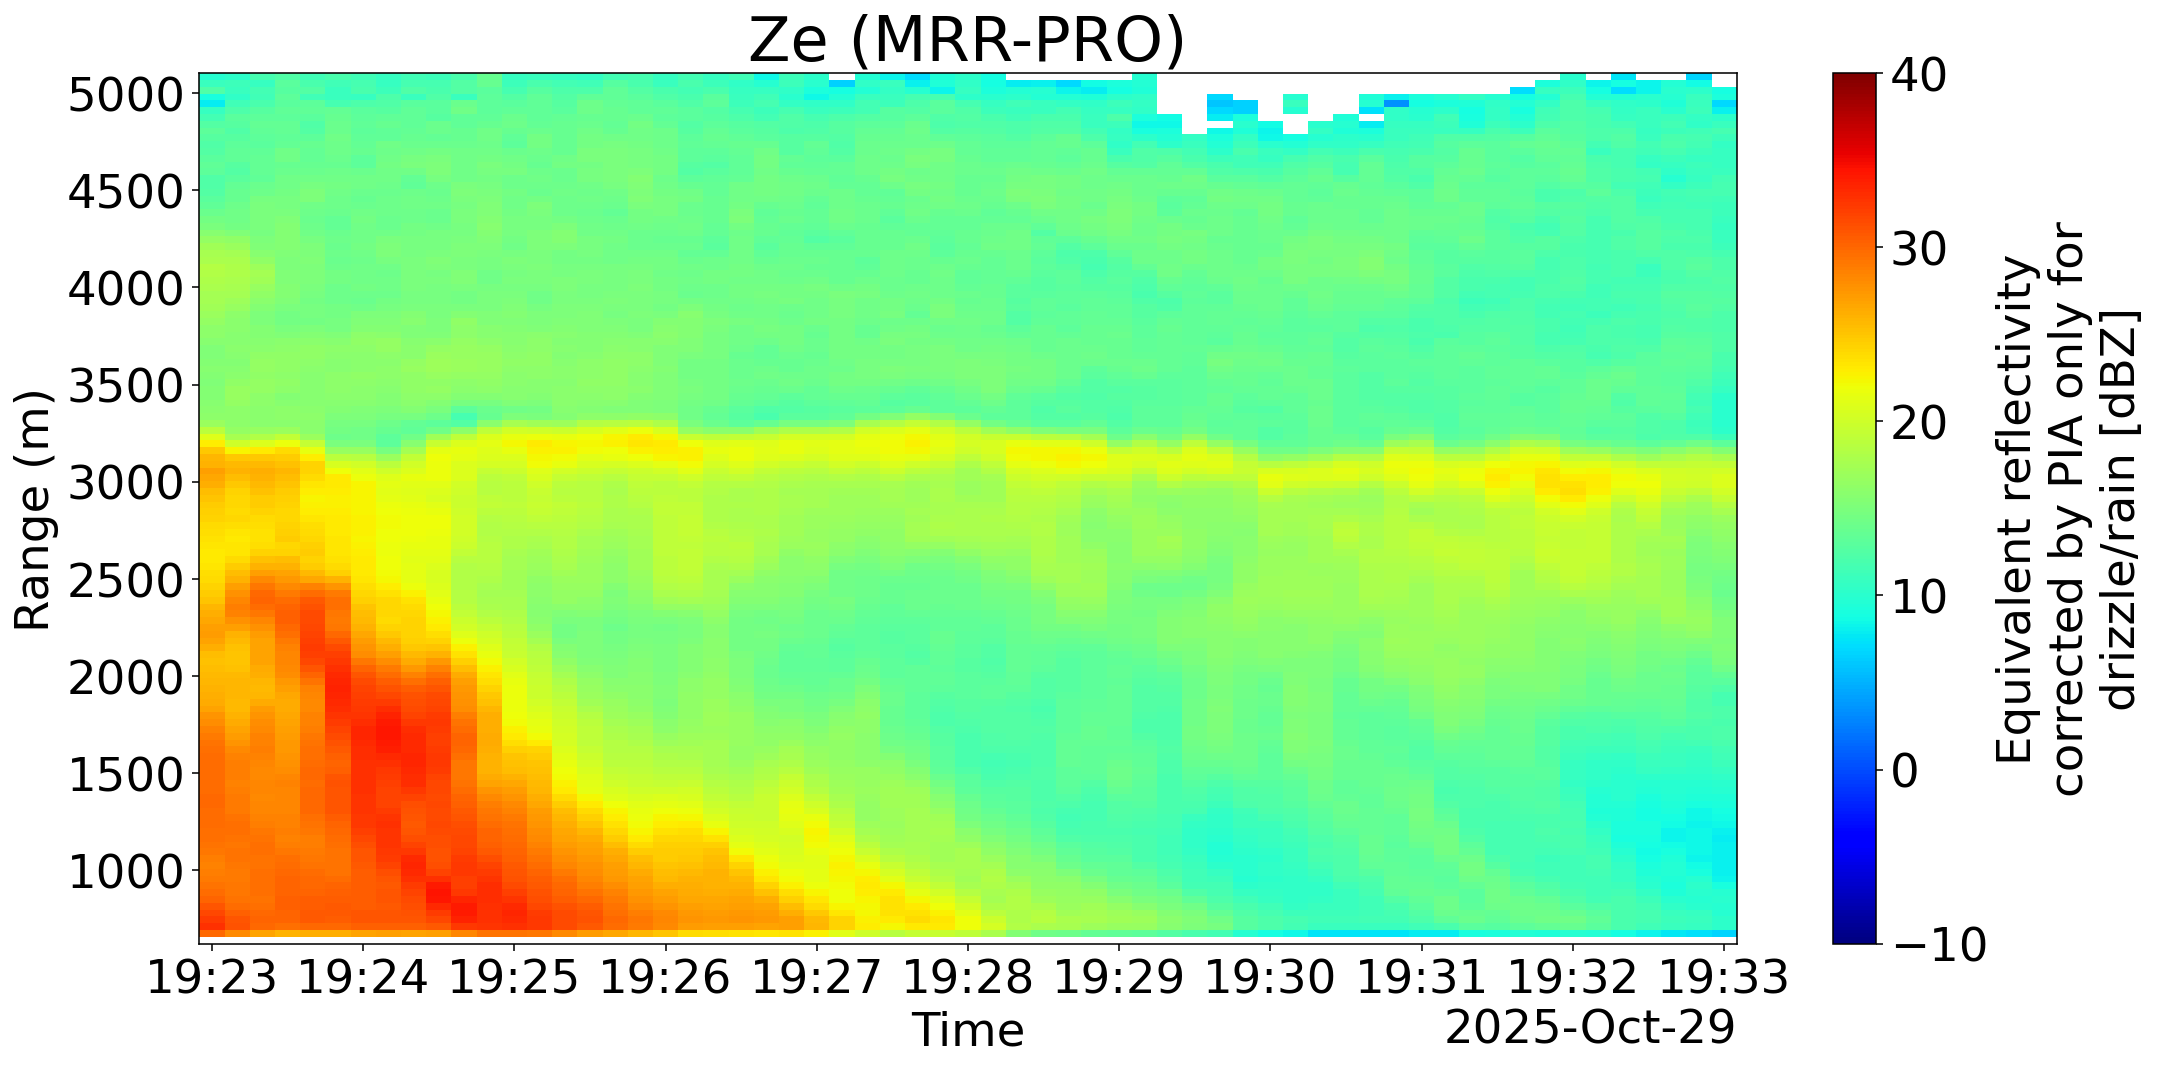
MRRProData.plot_spectrogram(spectrum_var="spe_3D")Range-by-Doppler spectrogram from the dealiased processed spectra.
uv run python scripts/build_plot_examples.py --only plot-spectrogram-raprompro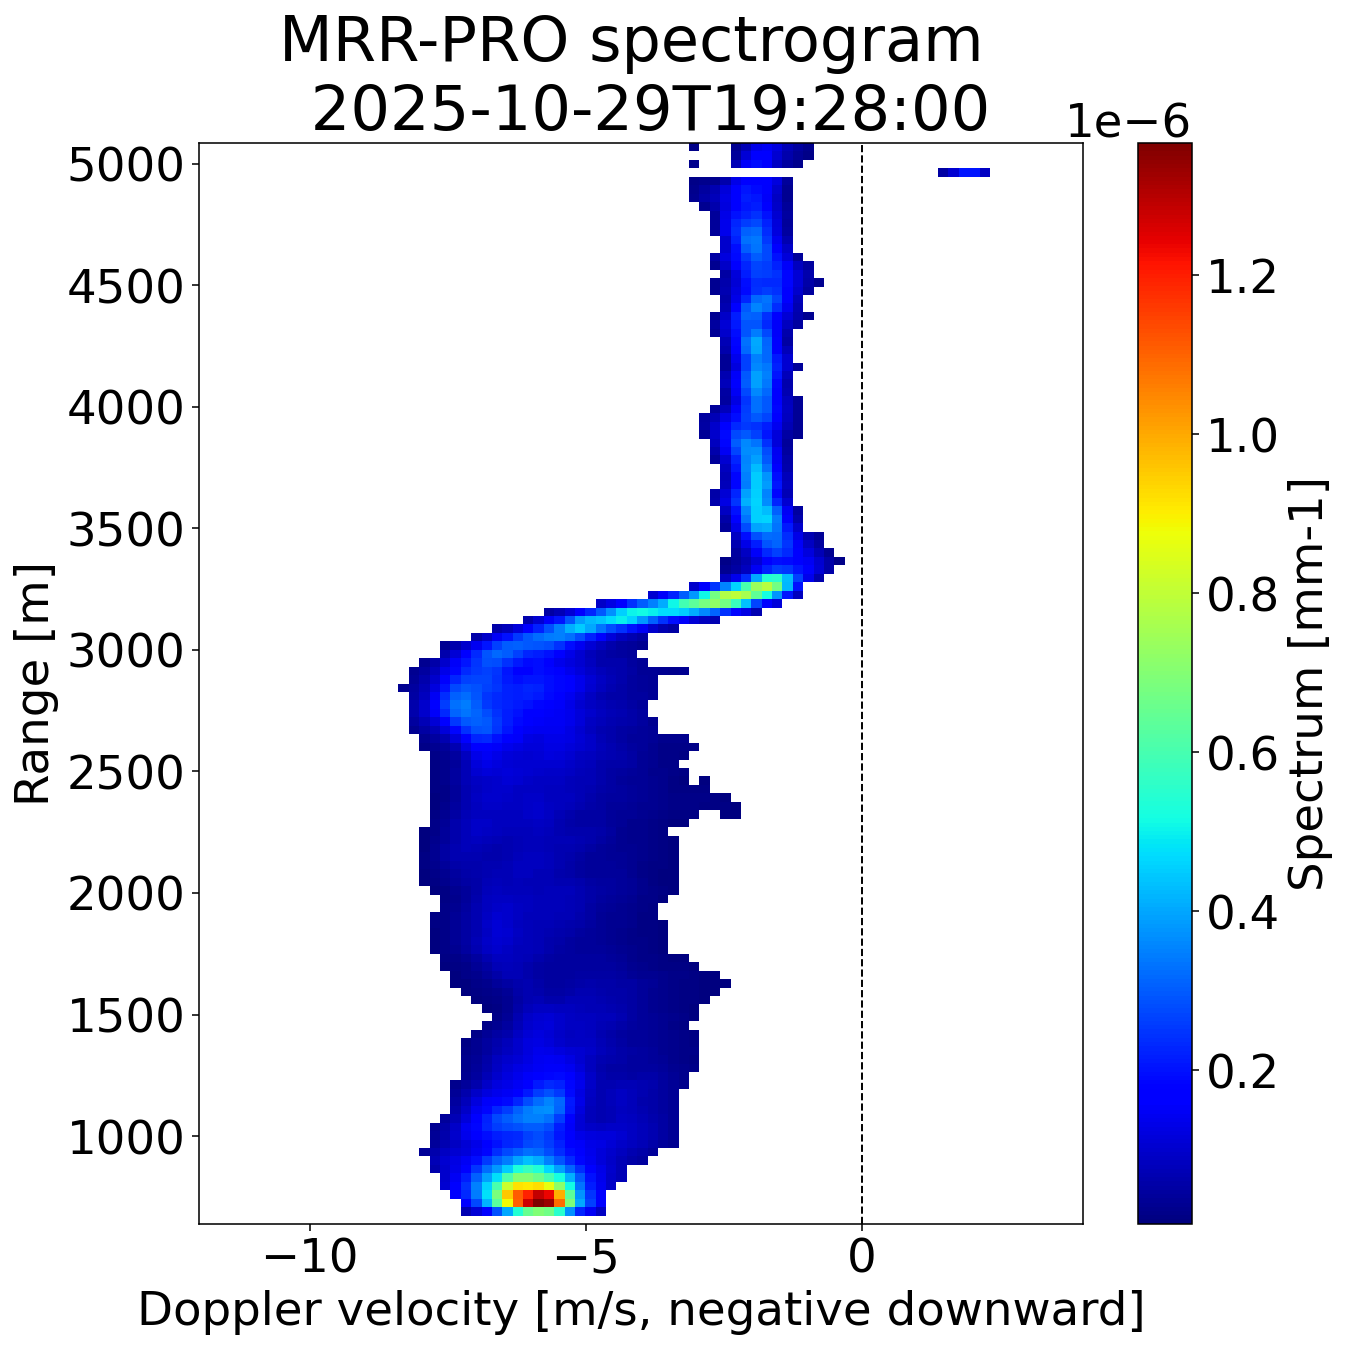
MRRProData.plot_DSDgram()Drop-size distribution as a range-by-drop-size image at one time.
uv run python scripts/build_plot_examples.py --only plot-dsdgram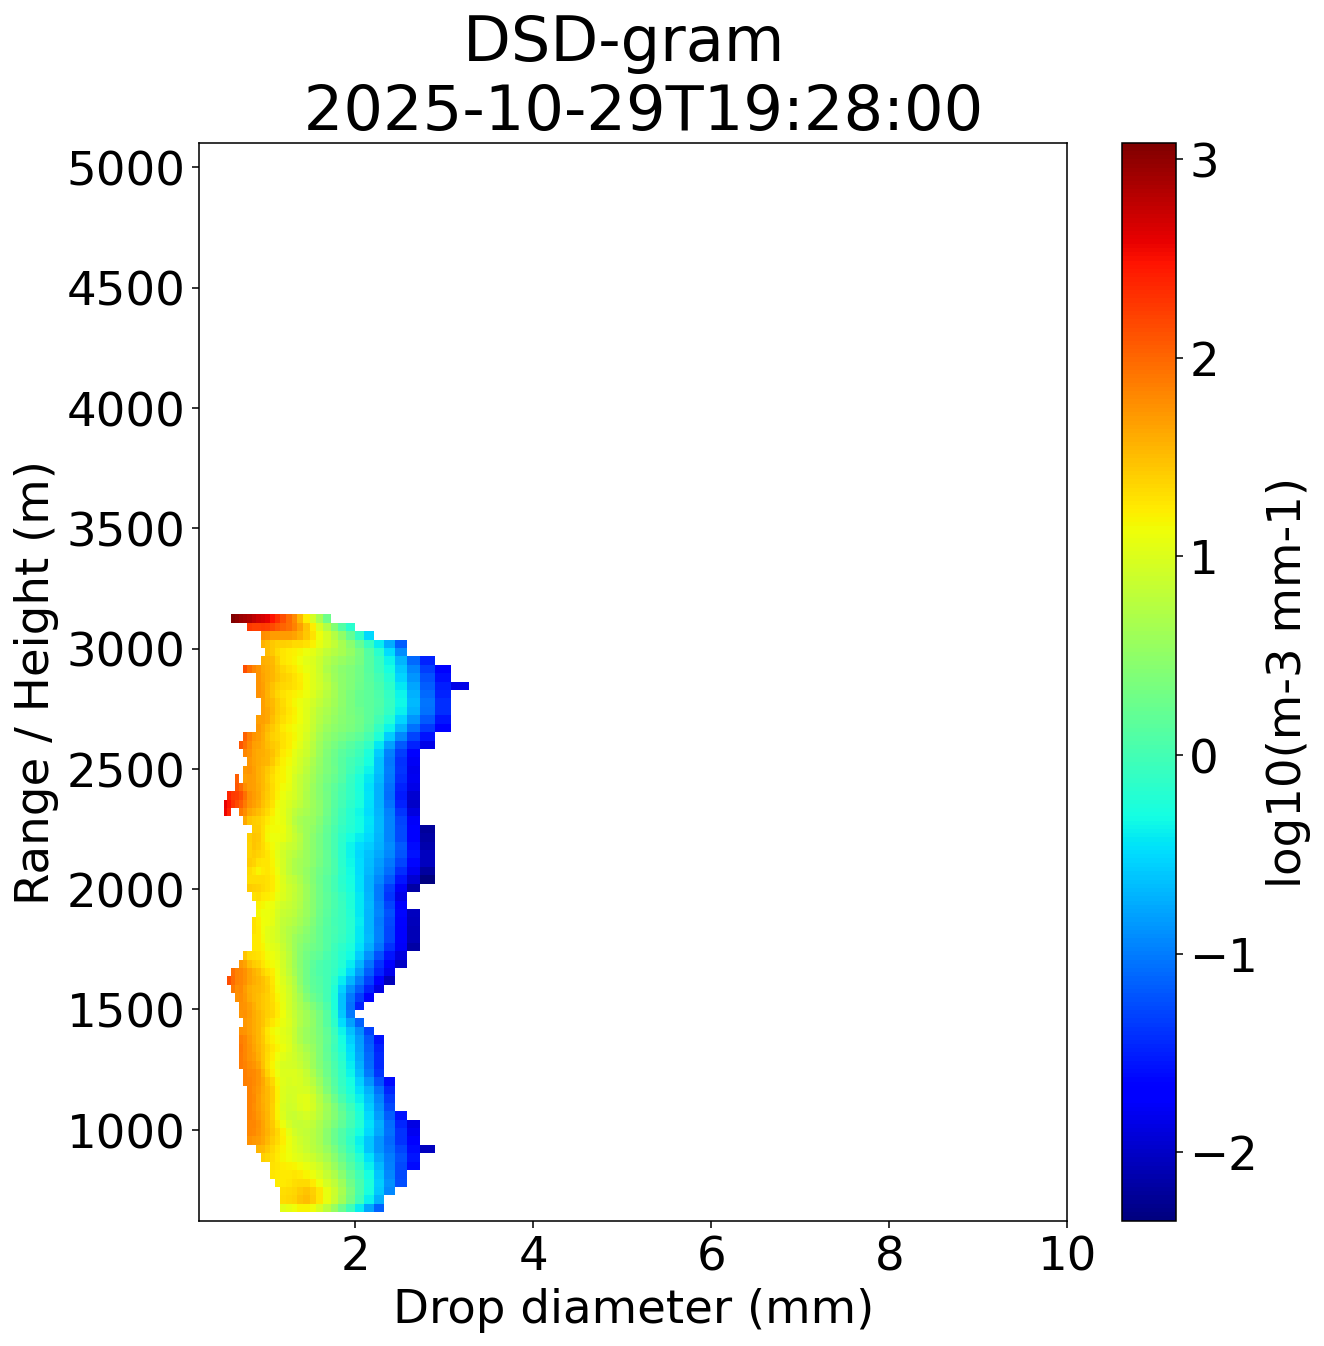
MRRProData.plot_DSD_by_range()Drop-size distribution curves at selected ranges.
uv run python scripts/build_plot_examples.py --only plot-dsd-by-range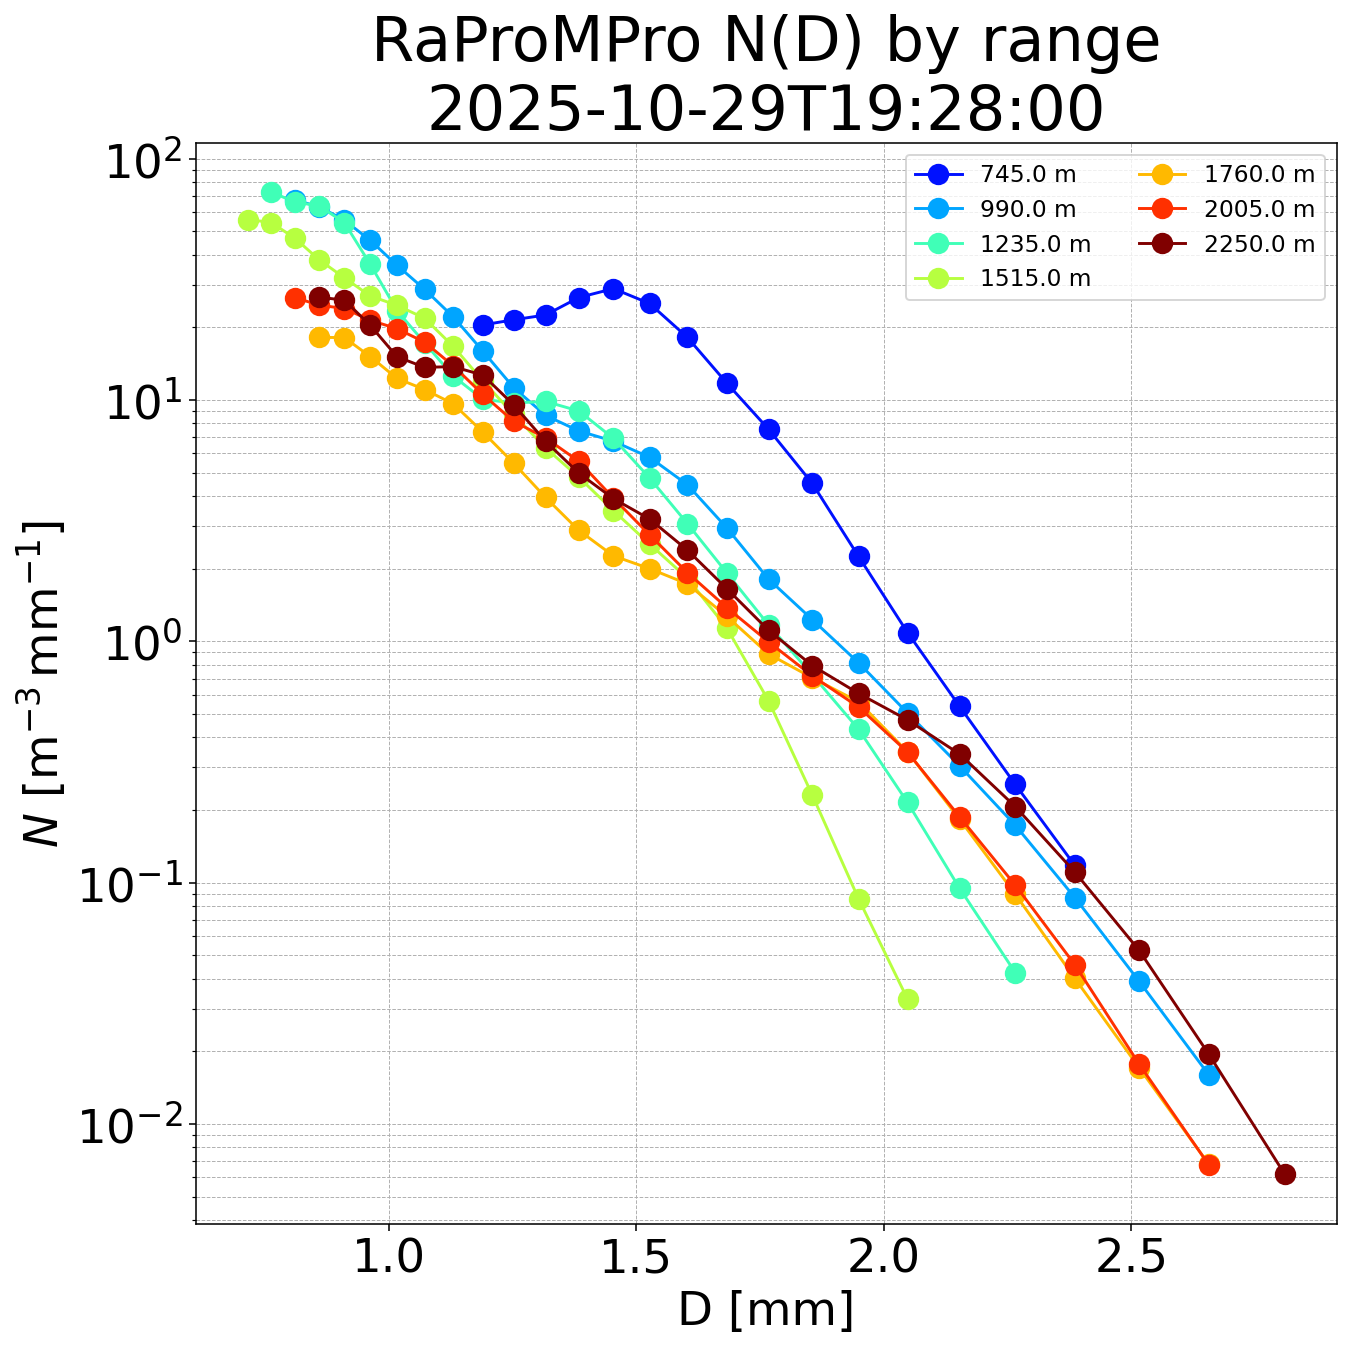
MRRProData.plot_microphysical_properties_profiles()Vertical profiles of processed microphysical variables at one time.
uv run python scripts/build_plot_examples.py --only plot-microphysical-profiles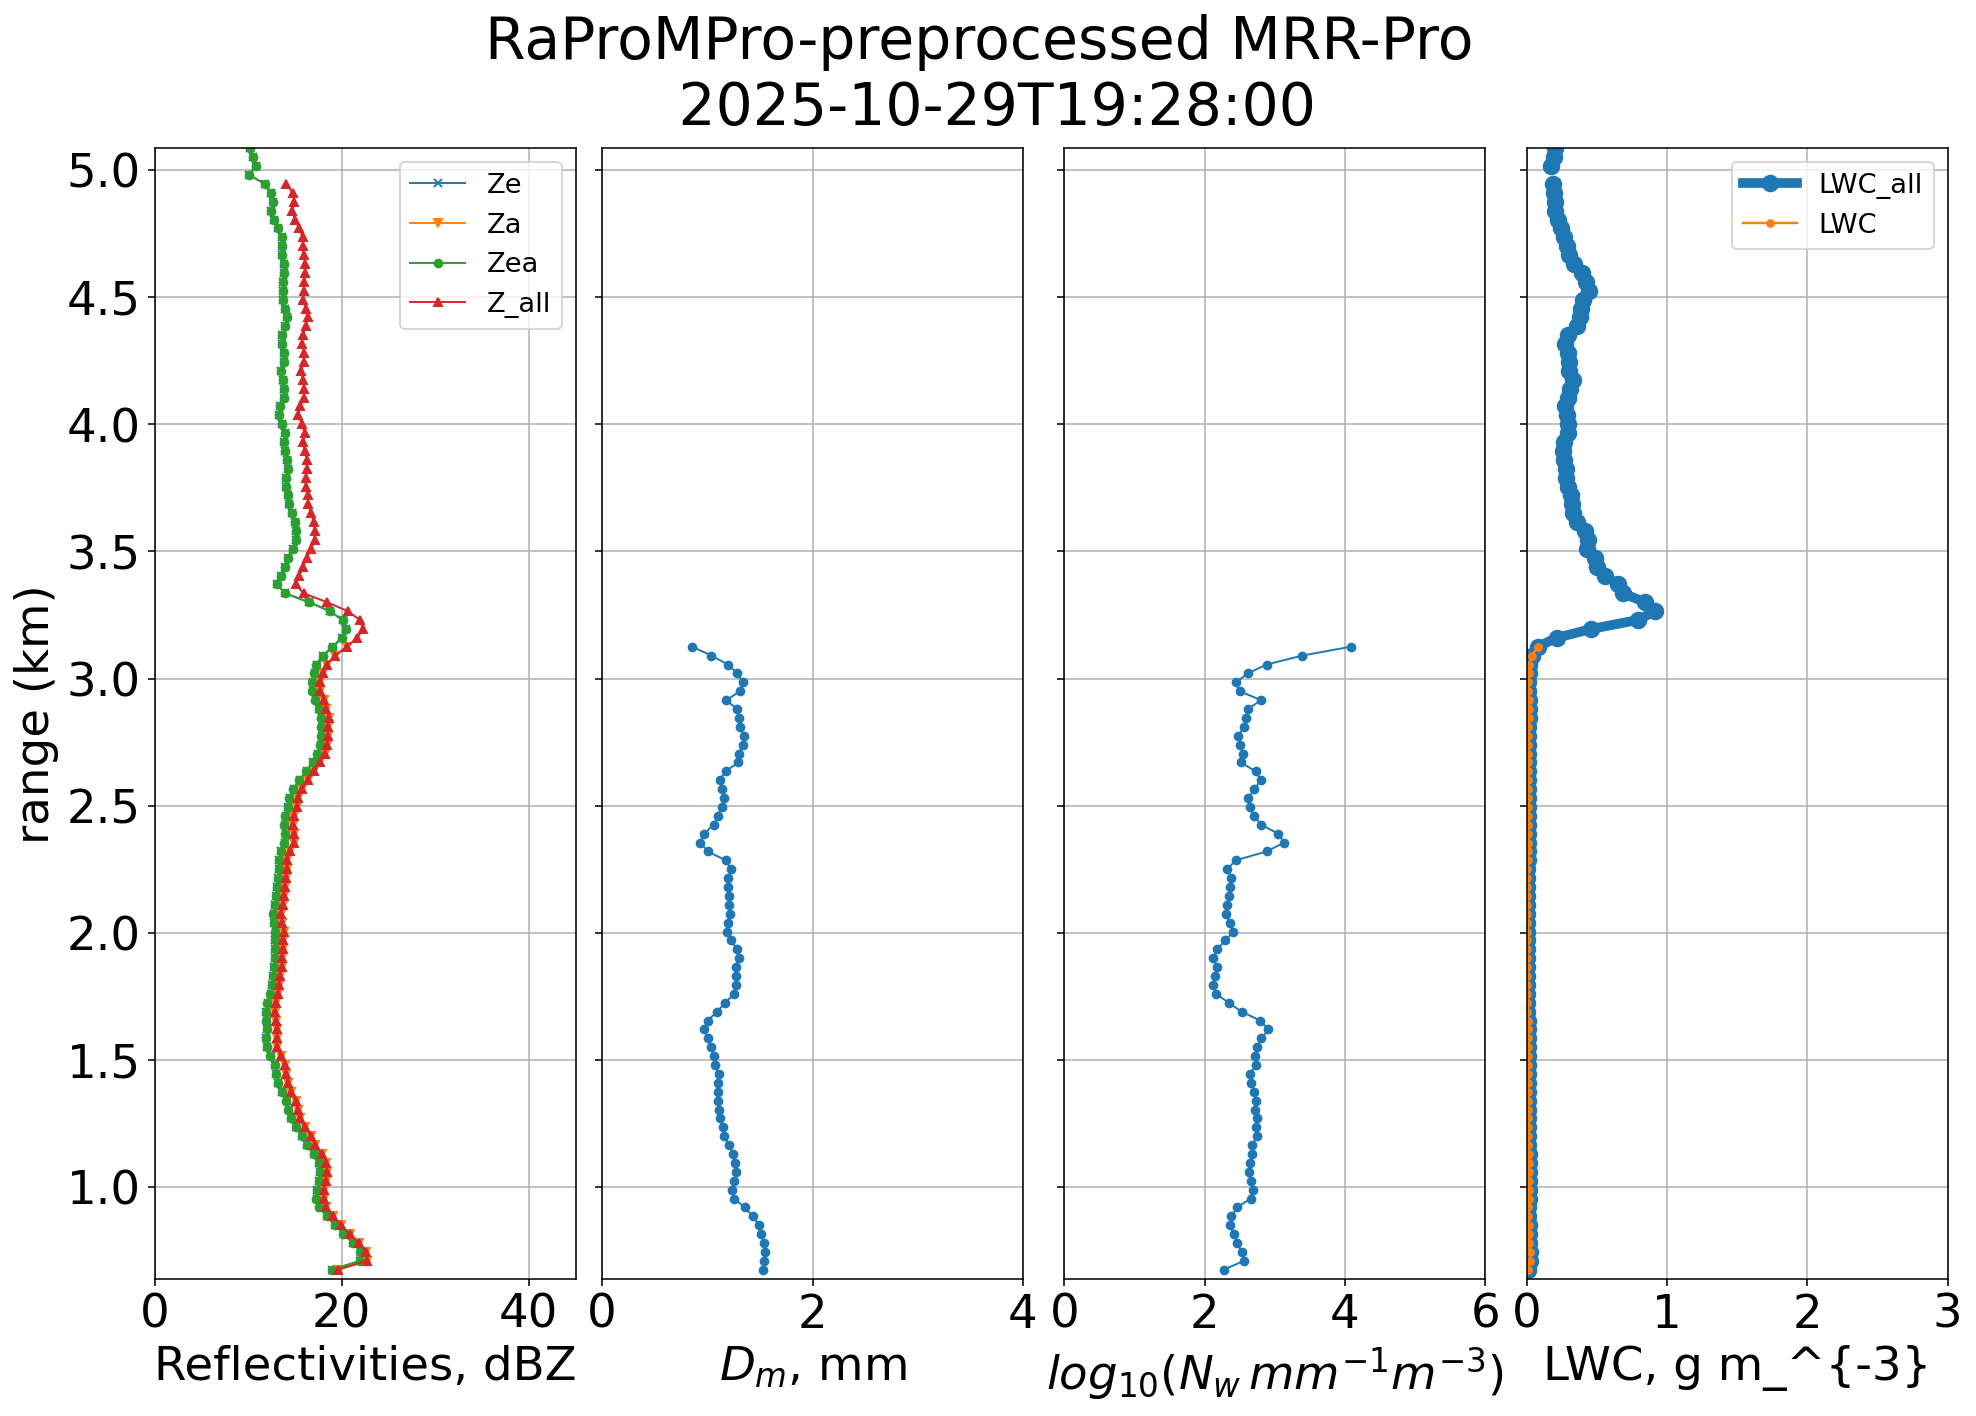
MRRProData.plot_rain_process_in_layer_2D()Layer event scatter of two microphysical variables, colored by a third.
uv run python scripts/build_plot_examples.py --only plot-rain-process-2d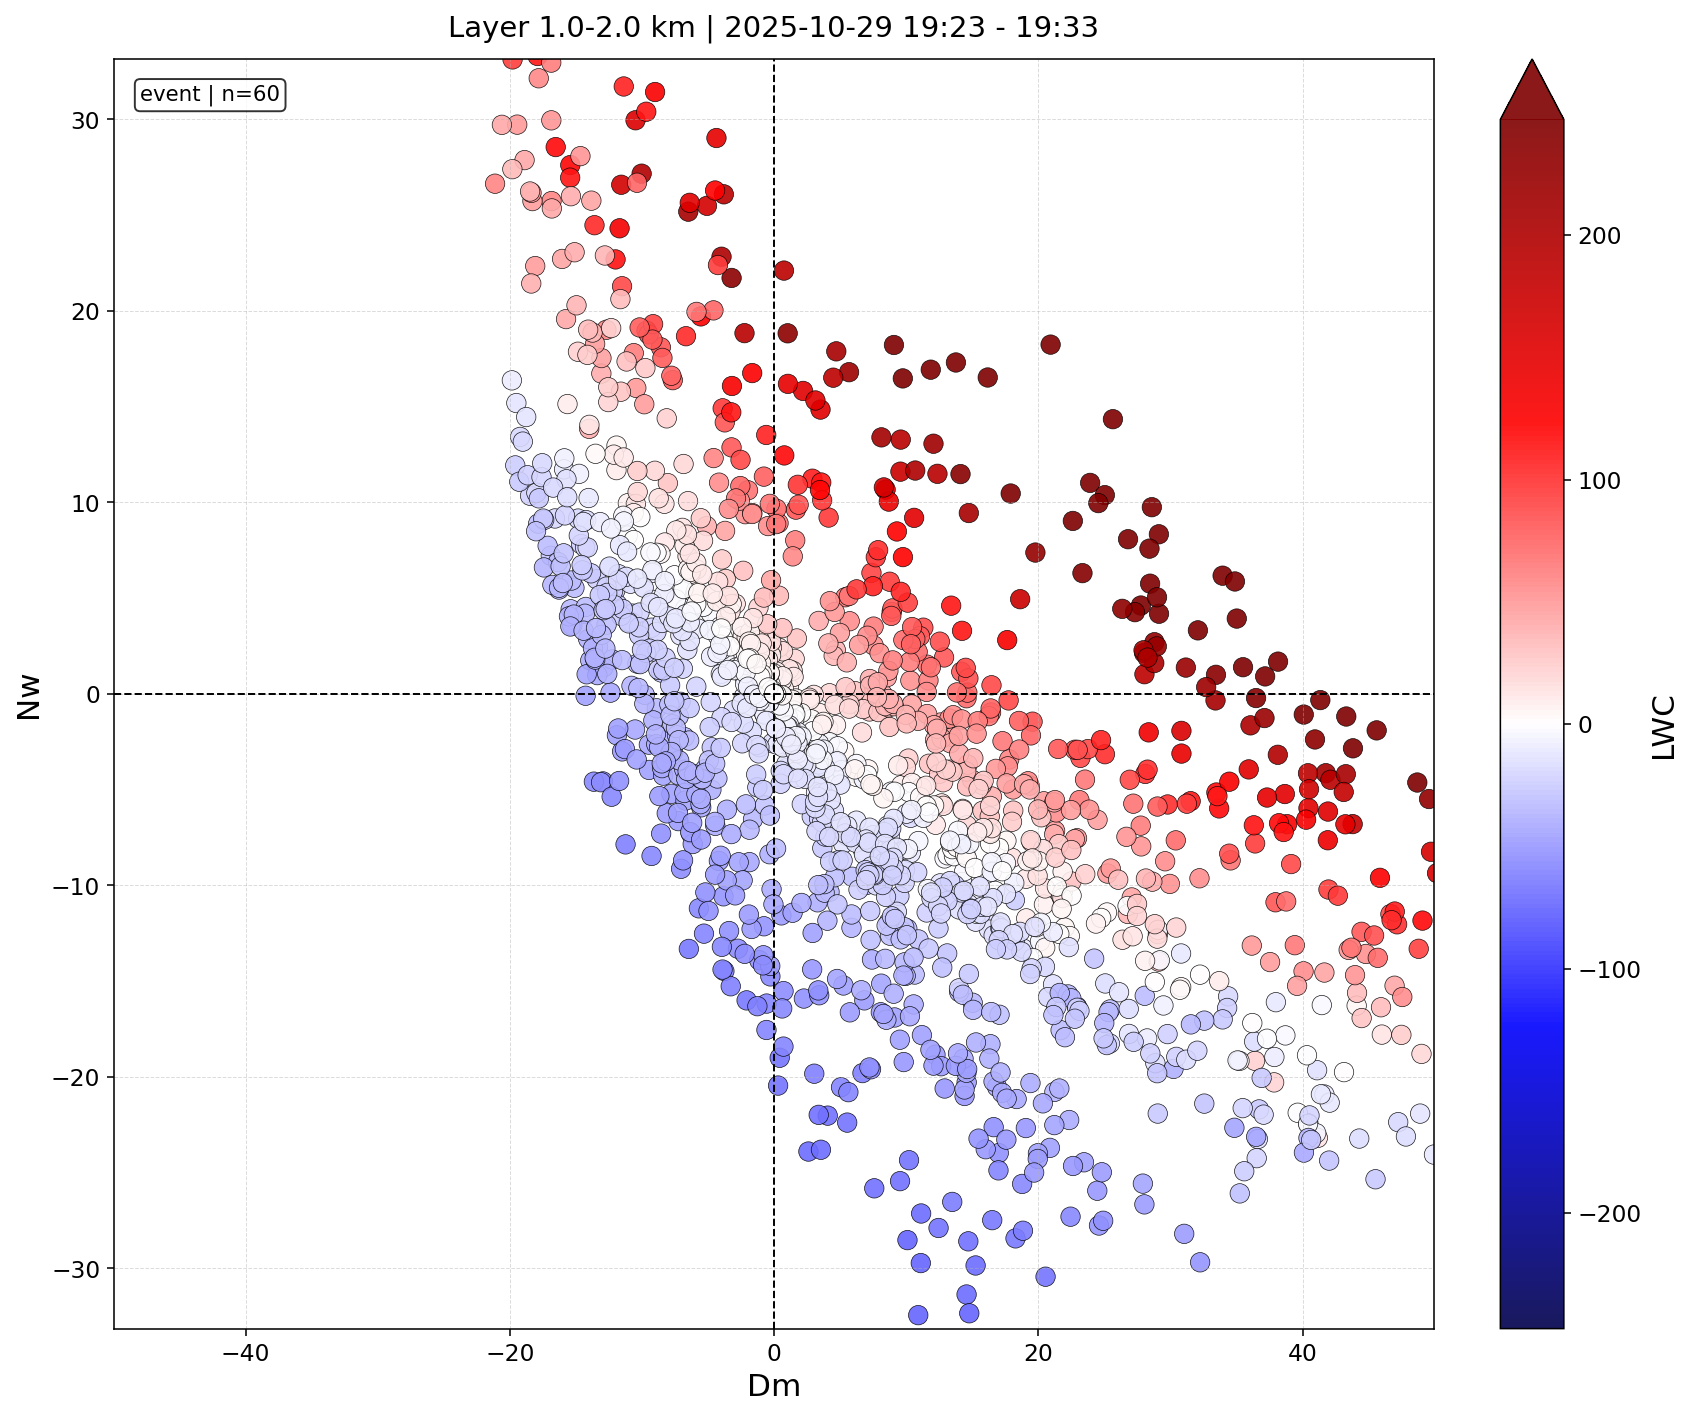
MRRProData.plot_event_scatter()Event-level scatter for a selected time window and height layer.
uv run python scripts/build_plot_examples.py --only plot-event-scatter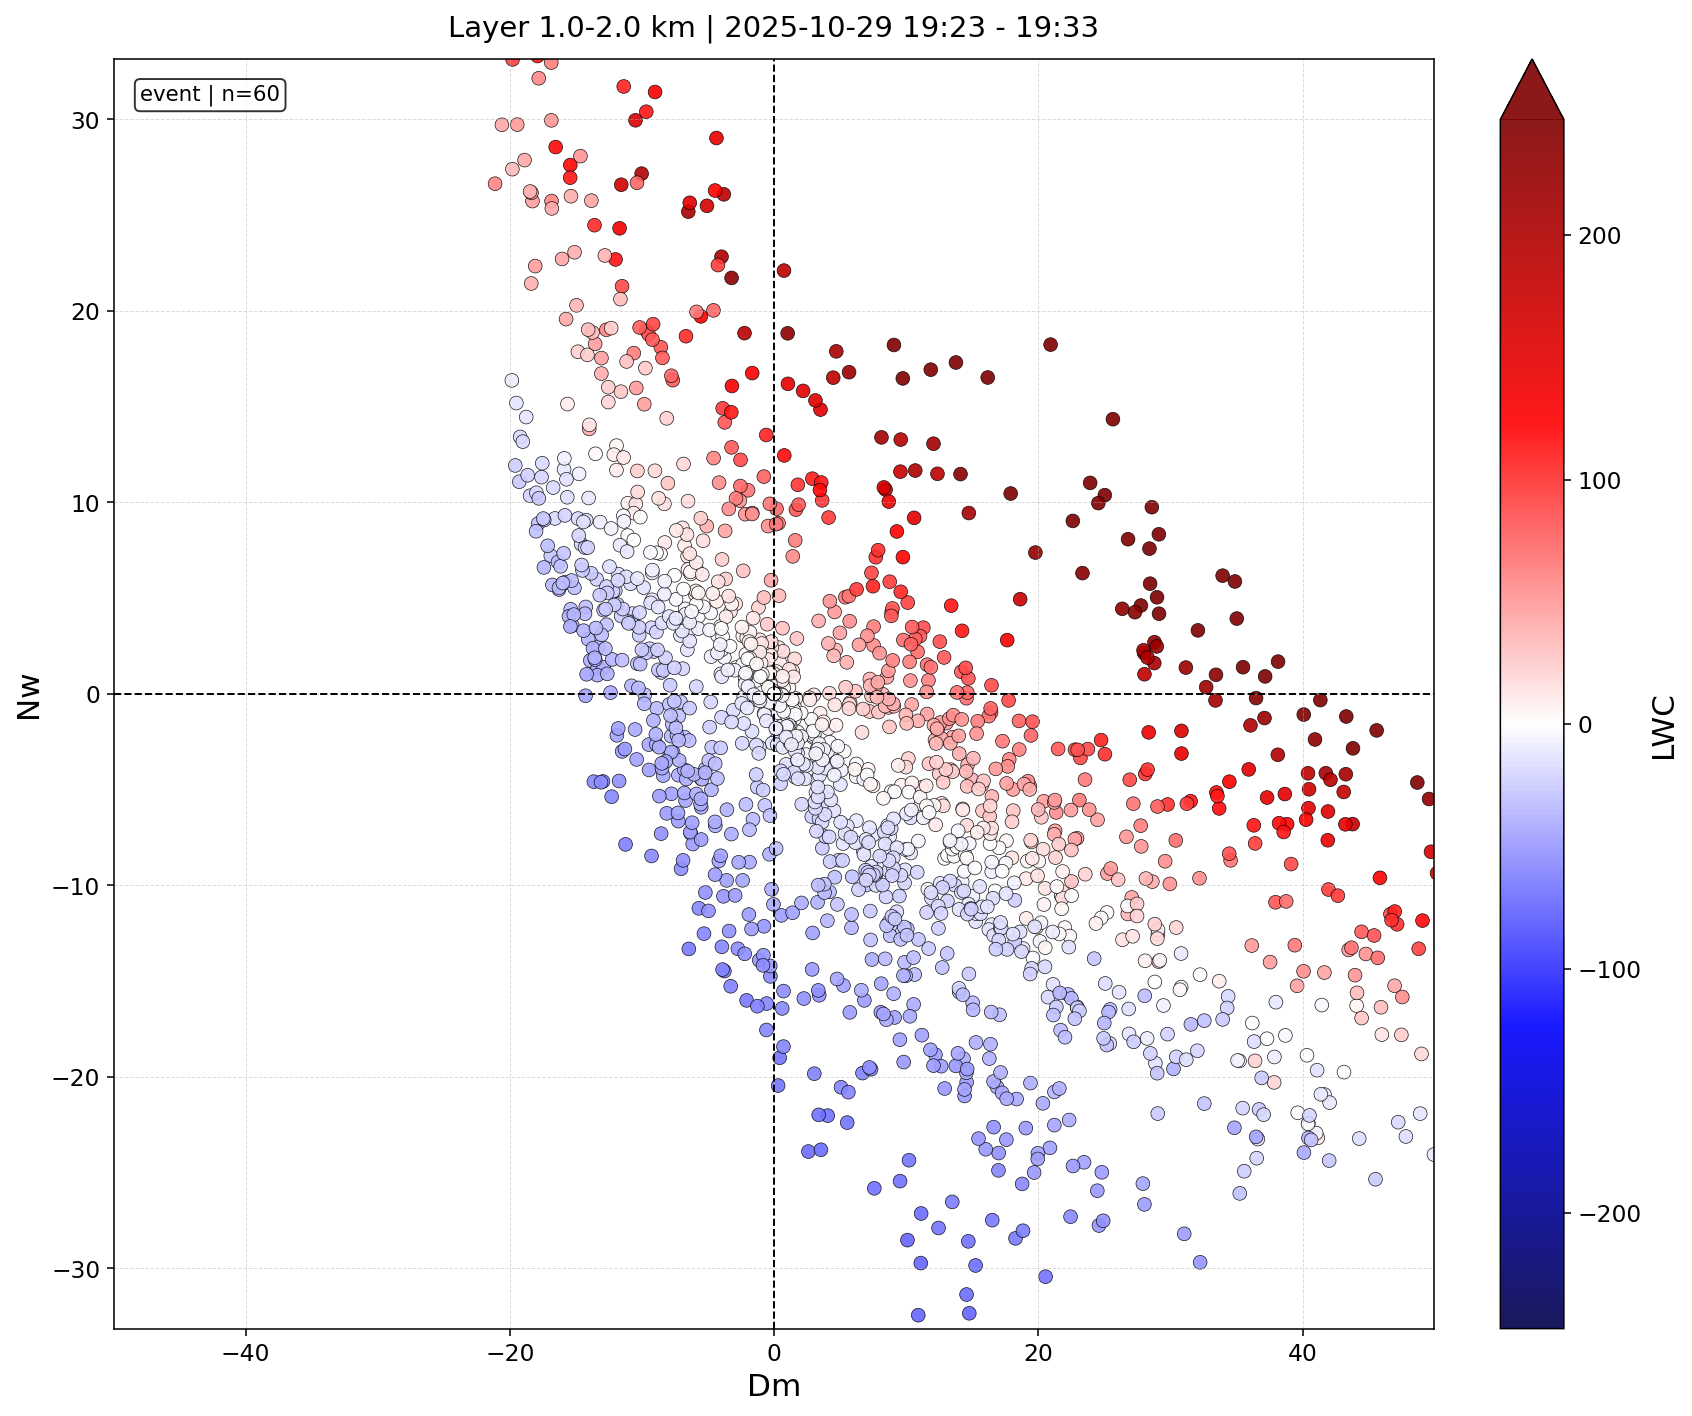
MRRProData.plot_region_scatter()Scatter filtered to selected classified process regions.
uv run python scripts/build_plot_examples.py --only plot-region-scatter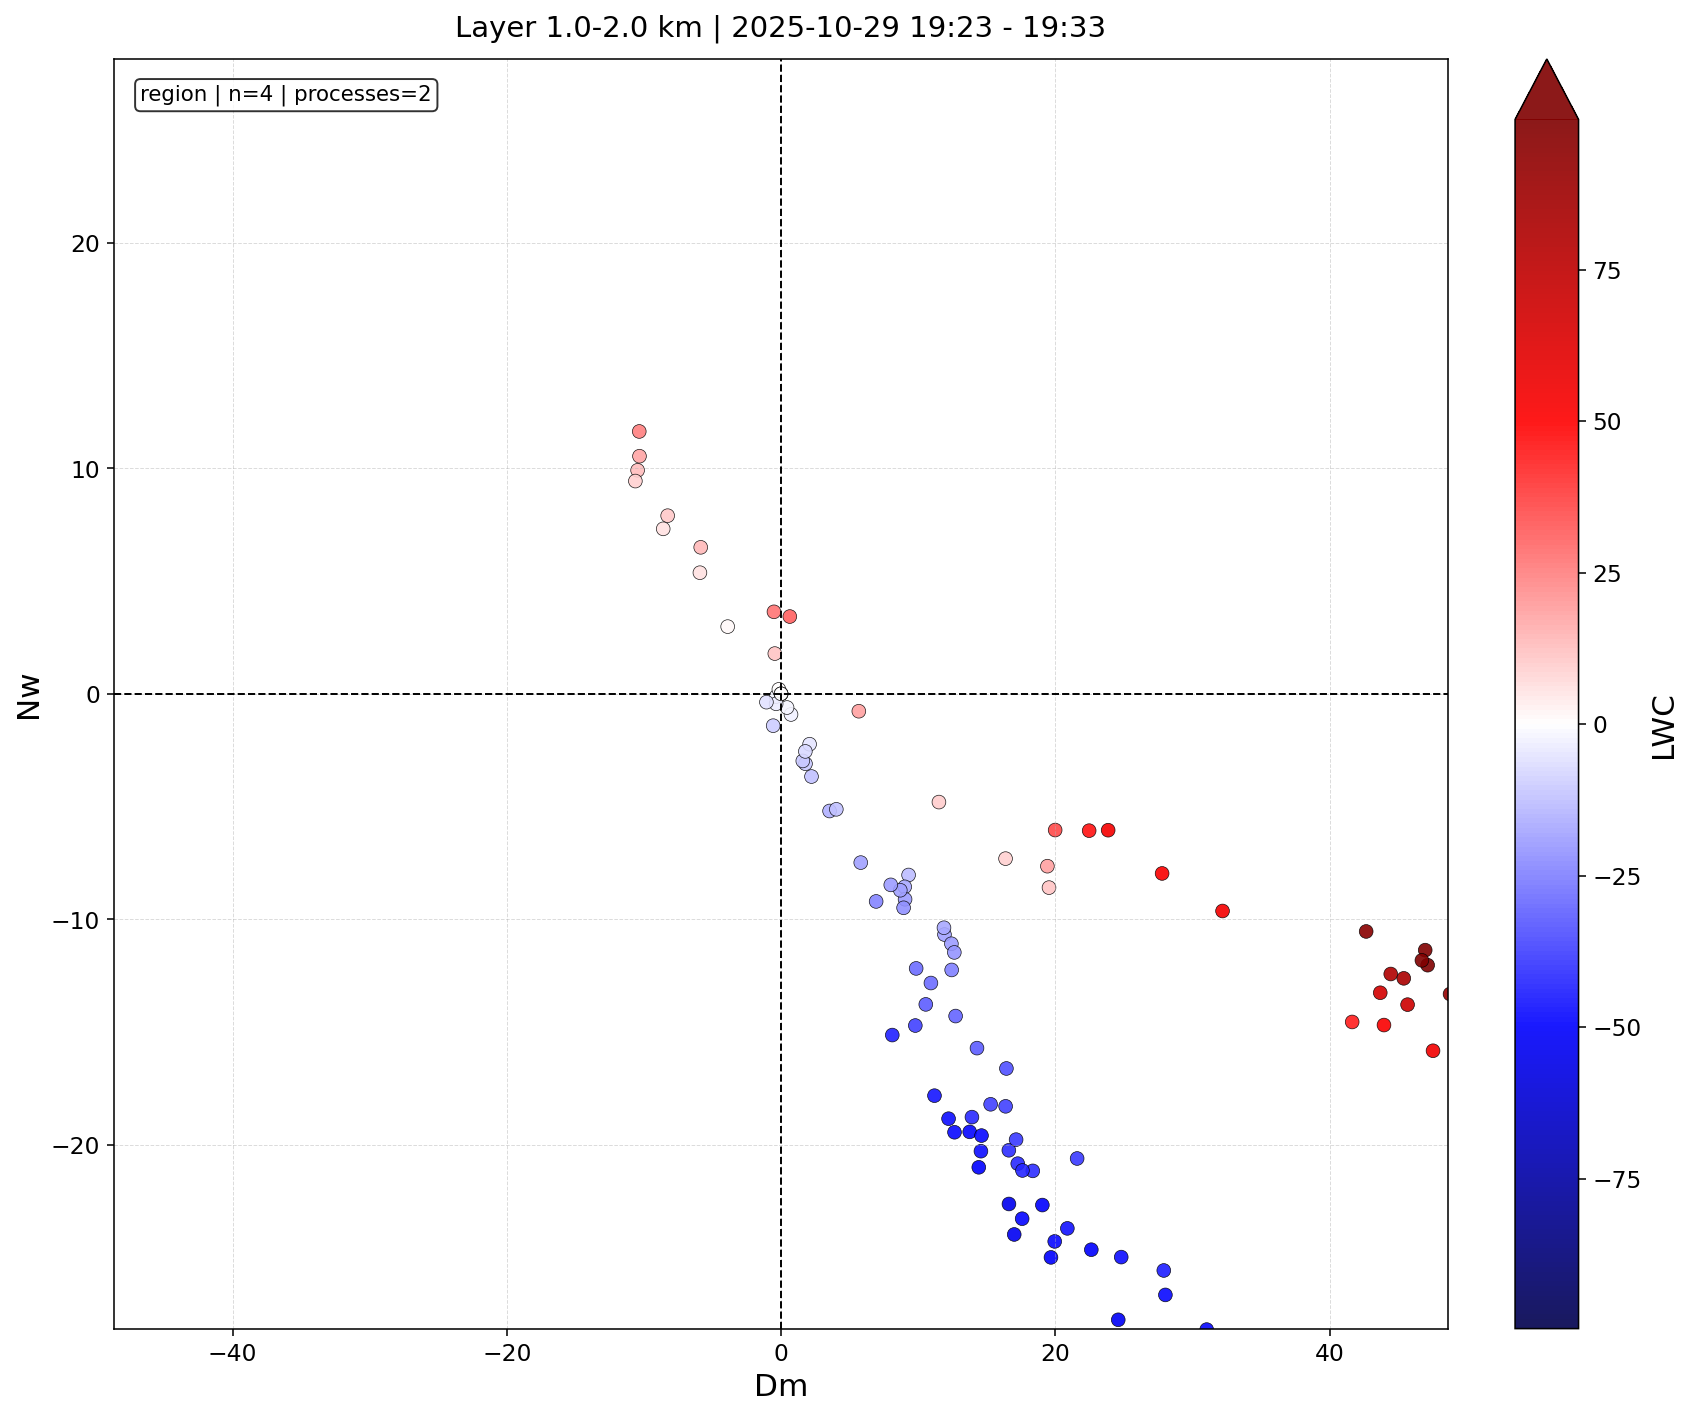
MRRProData.plot_process_scatter()Scatter for one representative classified process label.
uv run python scripts/build_plot_examples.py --only plot-process-scatter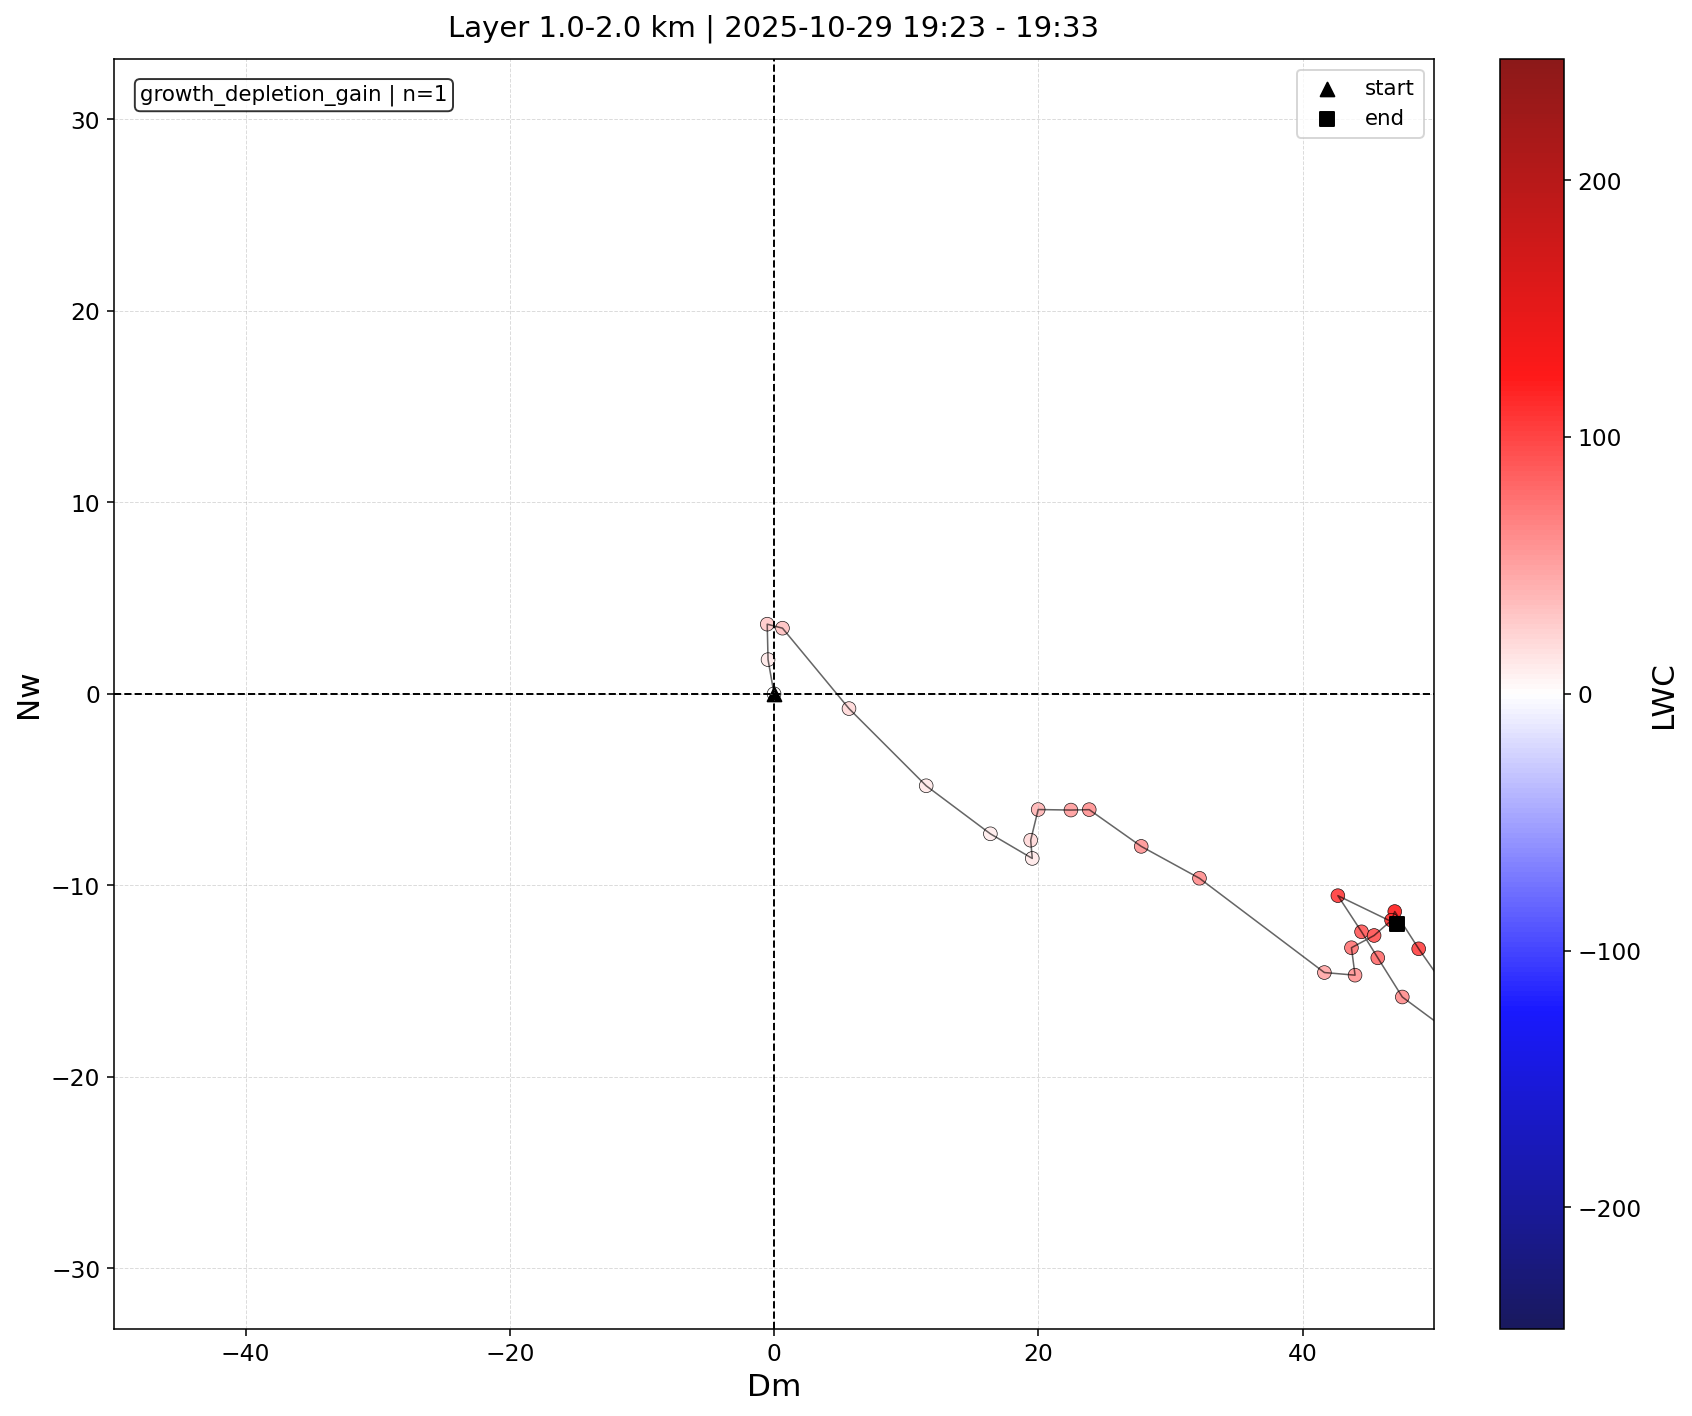
MRRProData.plot_event_vertical_percent_profiles()Relative vertical profiles through the selected rain event.
uv run python scripts/build_plot_examples.py --only plot-event-vertical-profiles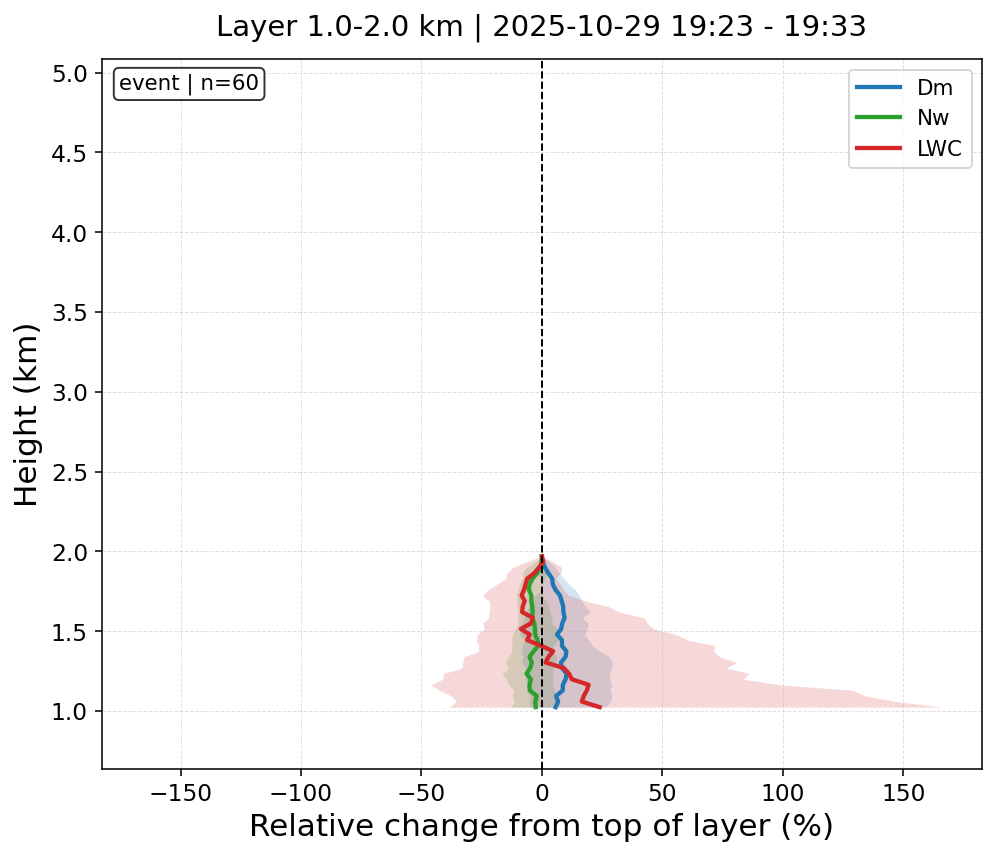
MRRProData.plot_process_vertical_percent_profiles()Relative vertical profiles filtered by one process label.
uv run python scripts/build_plot_examples.py --only plot-process-vertical-profiles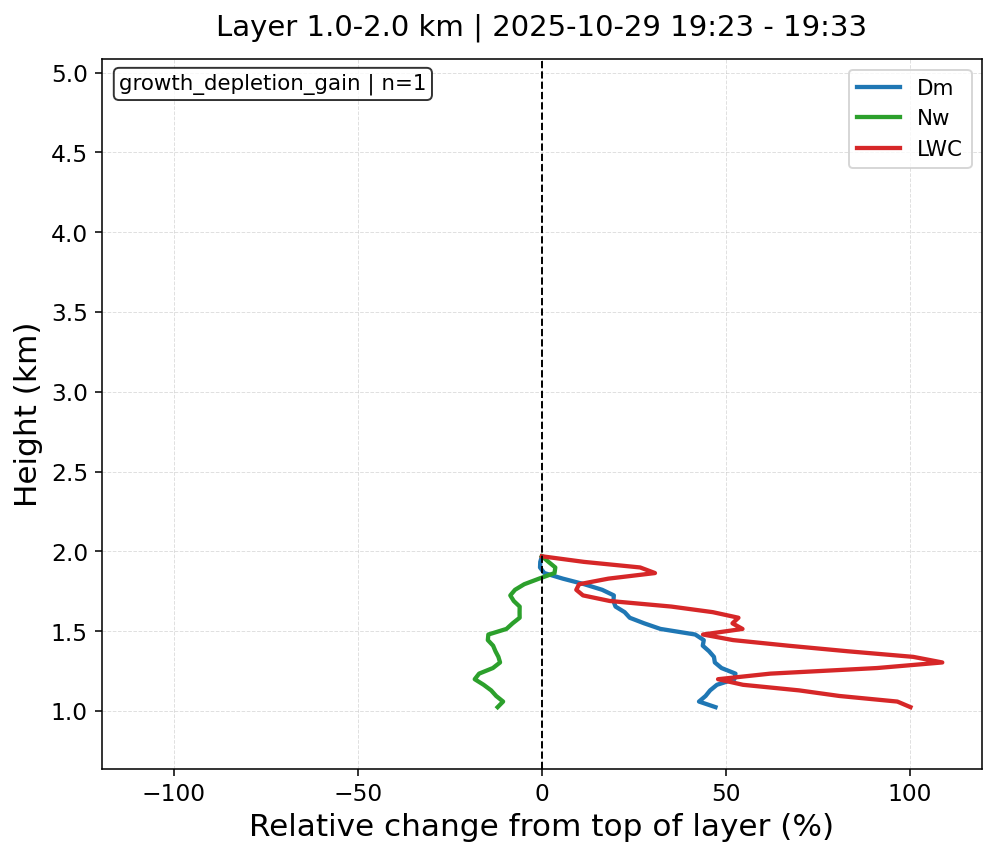
MRRProData.plot_rain_process_in_layer_hexagram()Layer trend samples projected on the RGB process hexagram.
uv run python scripts/build_plot_examples.py --only plot-layer-hexagram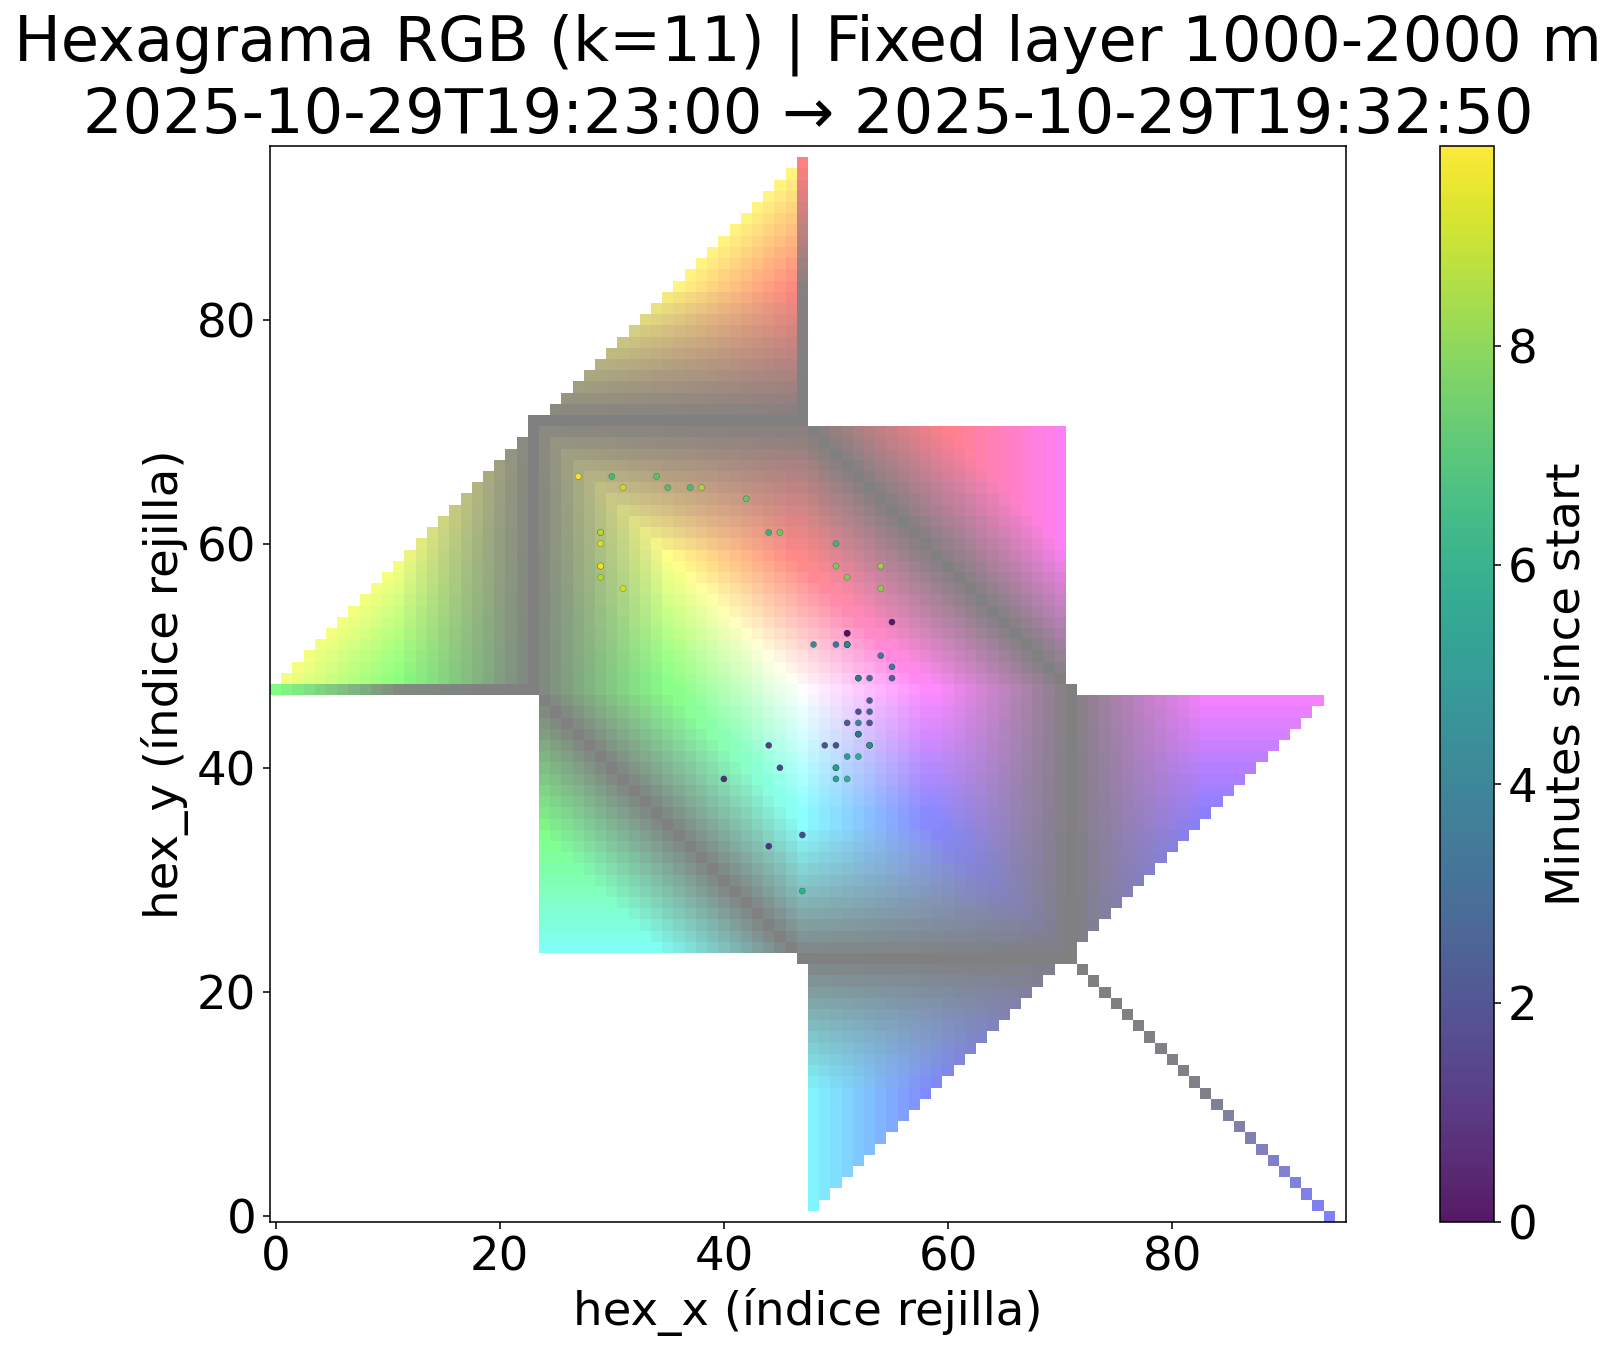
MRRProData.plot_processes_evolution()Multipanel summary of process classification evolution through time.
uv run python scripts/build_plot_examples.py --only plot-processes-evolution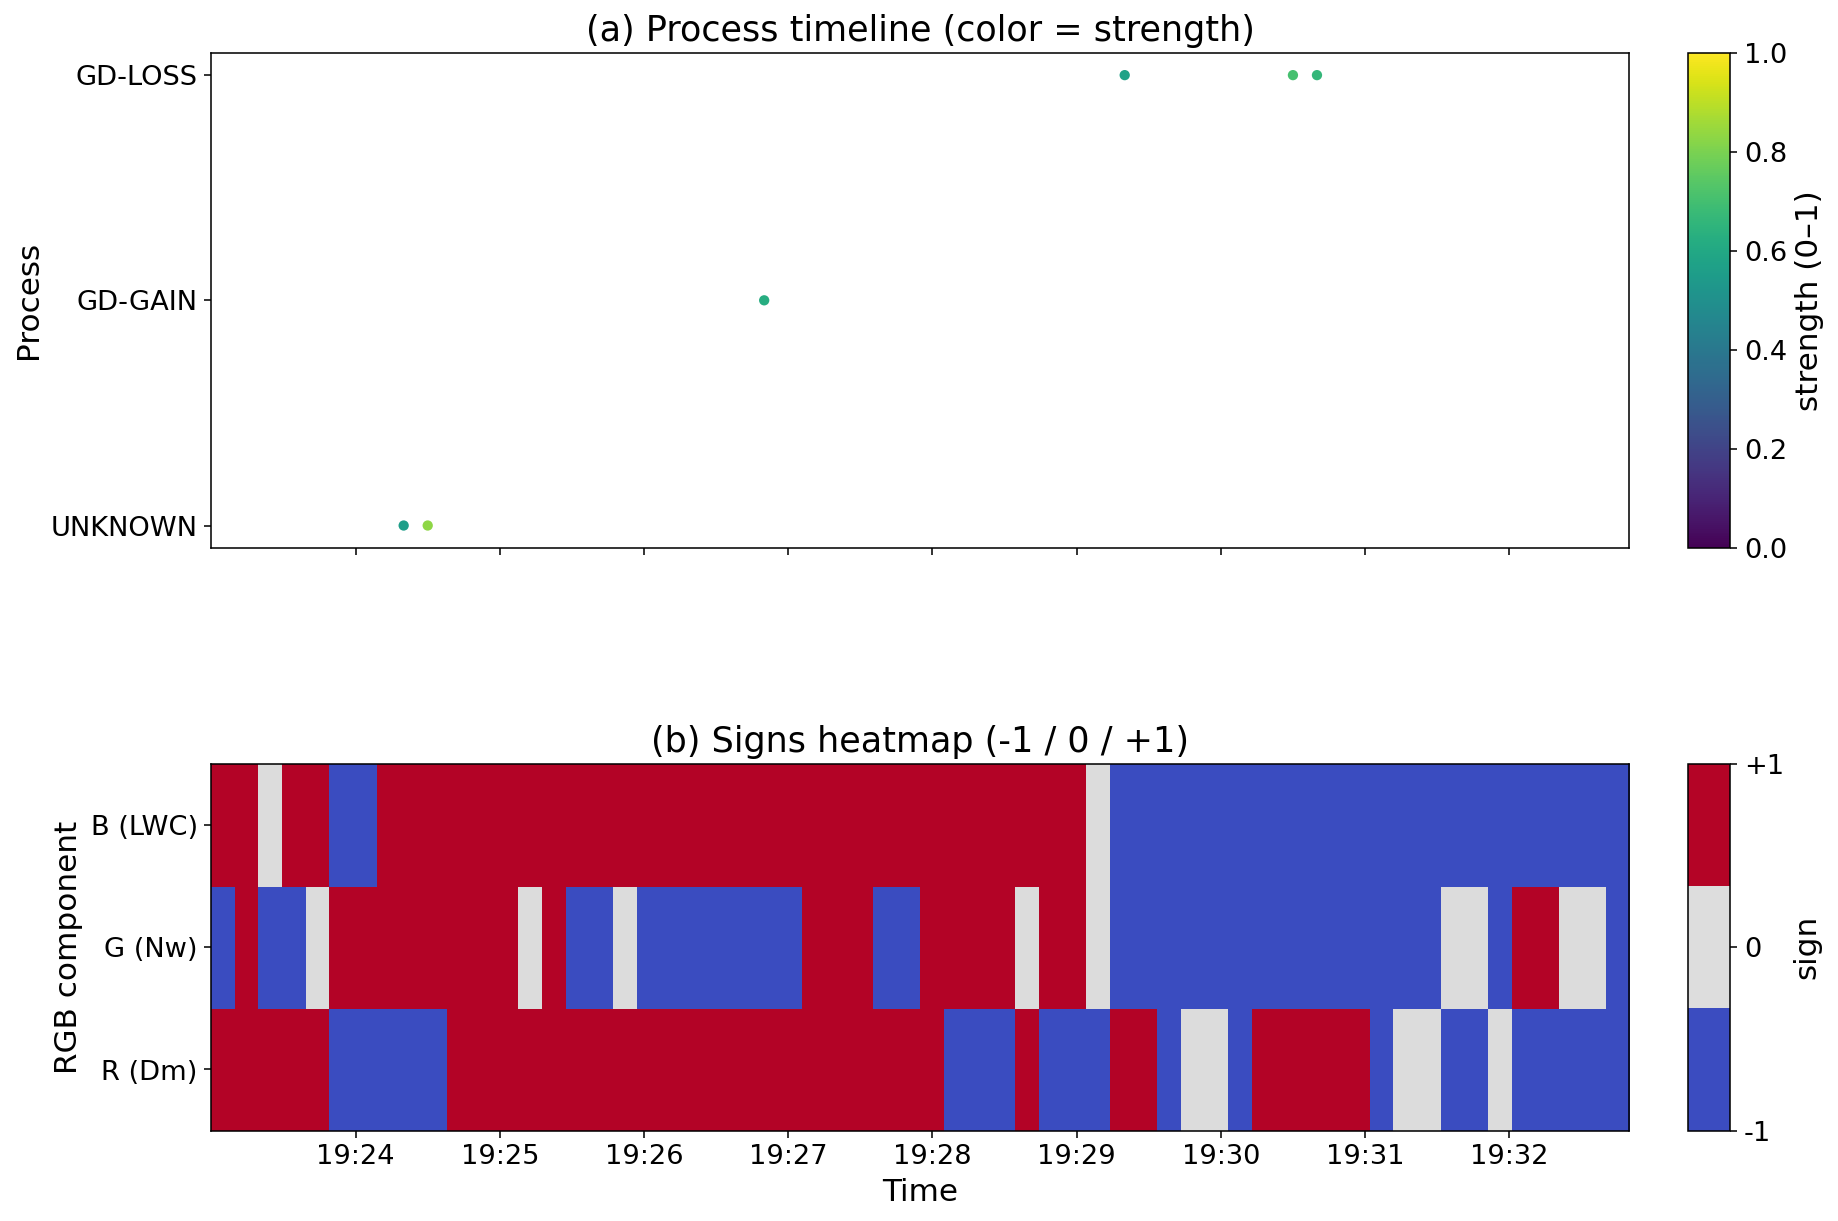
MRRProData.plot_classified_processes_on_hexagram()Classified process samples over the RGB hexagram background.
uv run python scripts/build_plot_examples.py --only plot-classified-hexagram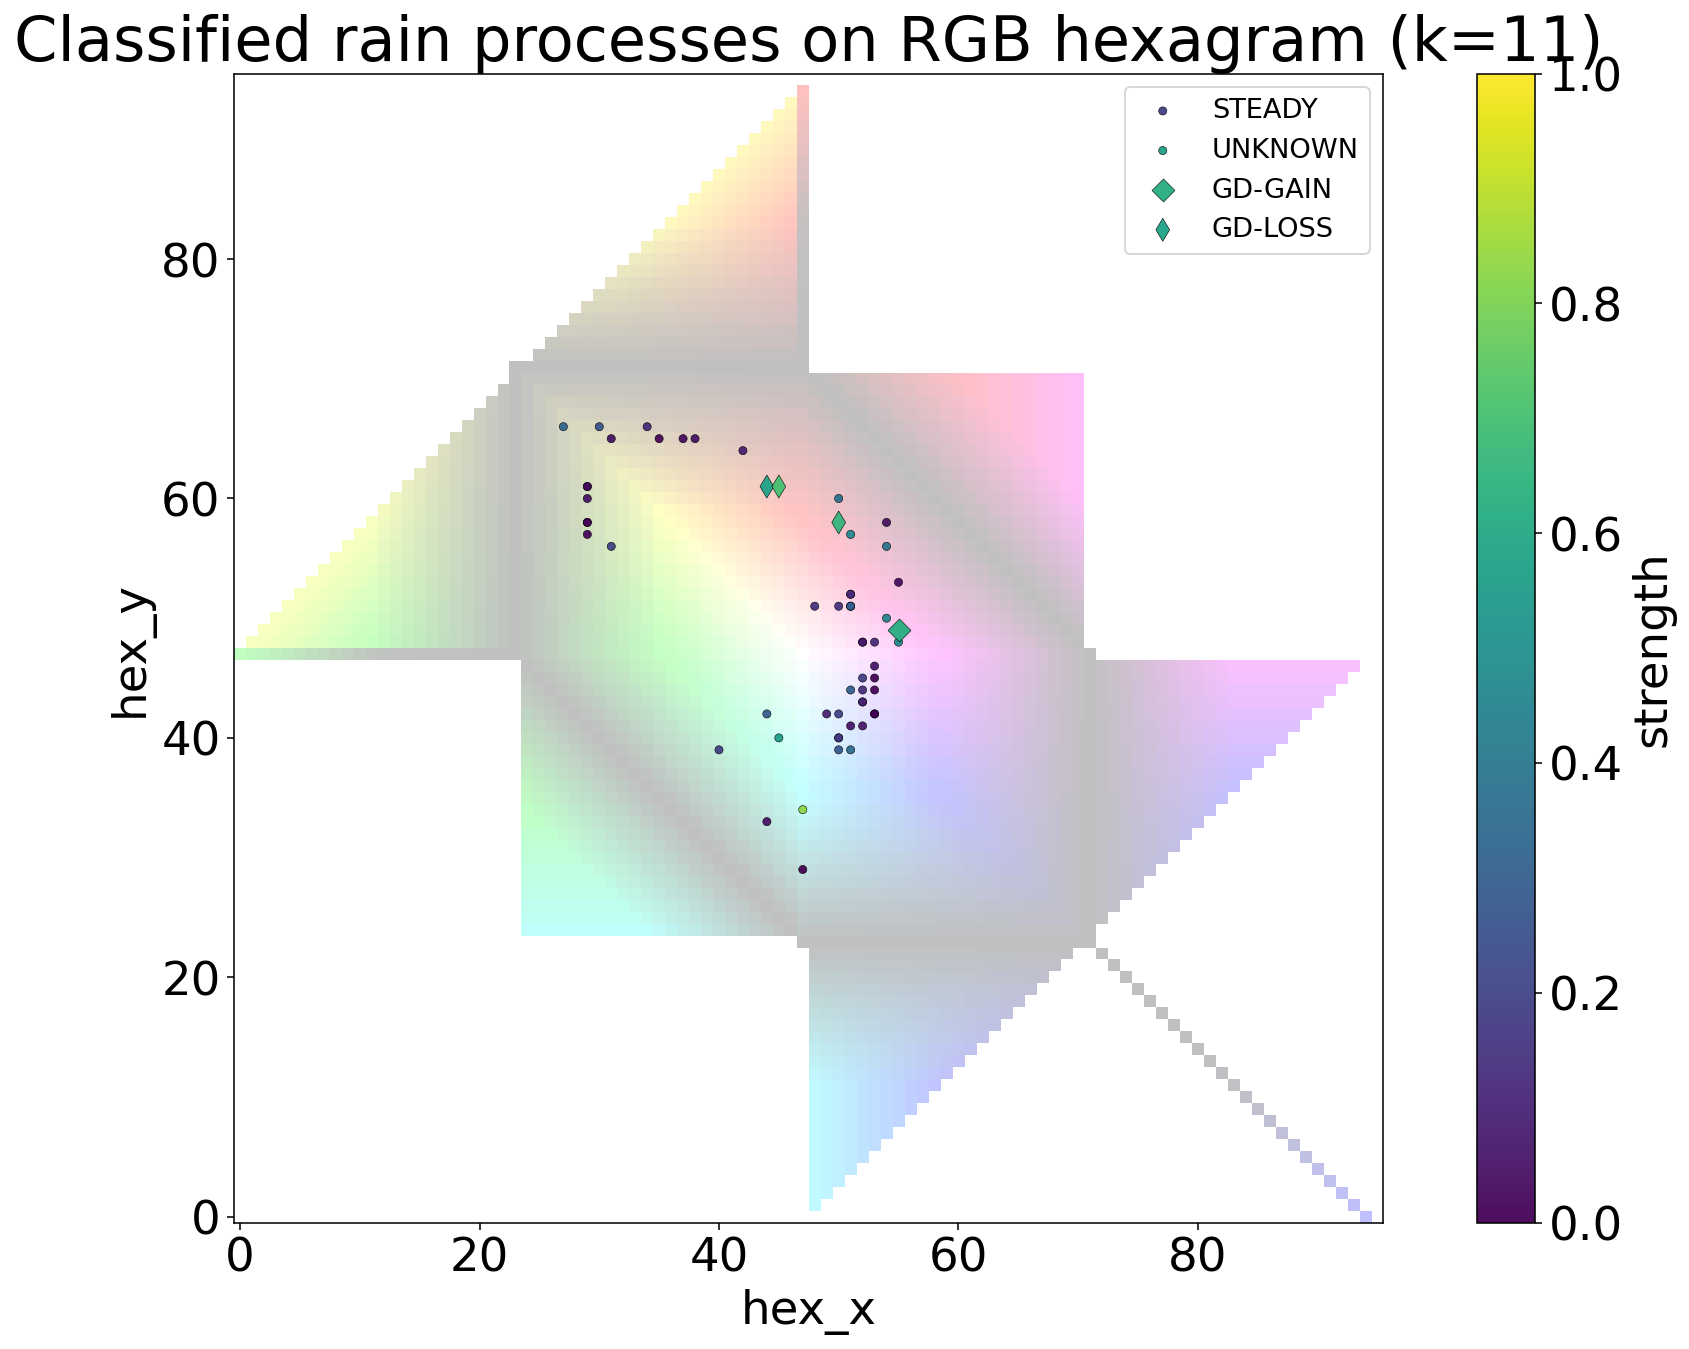
MRRProData.plot_column_process_scan()Column scan of rain-process labels across time and height windows.
uv run python scripts/build_plot_examples.py --only plot-column-process-scan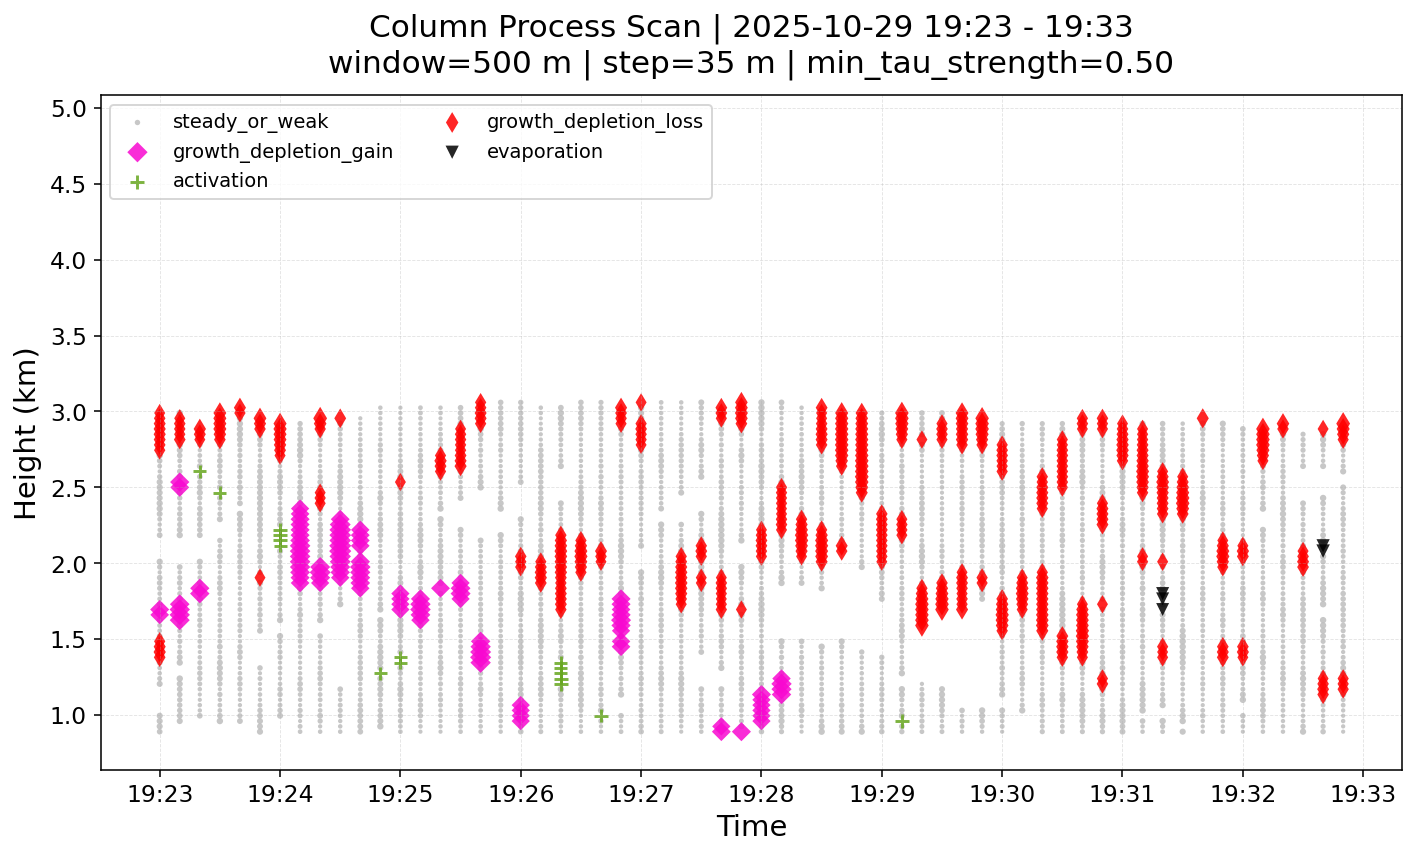
MRRProData.plot_scan_process_scatter_compare()Process-wise scatter comparison from the column scan dataframe.
uv run python scripts/build_plot_examples.py --only plot-scan-scatter-compare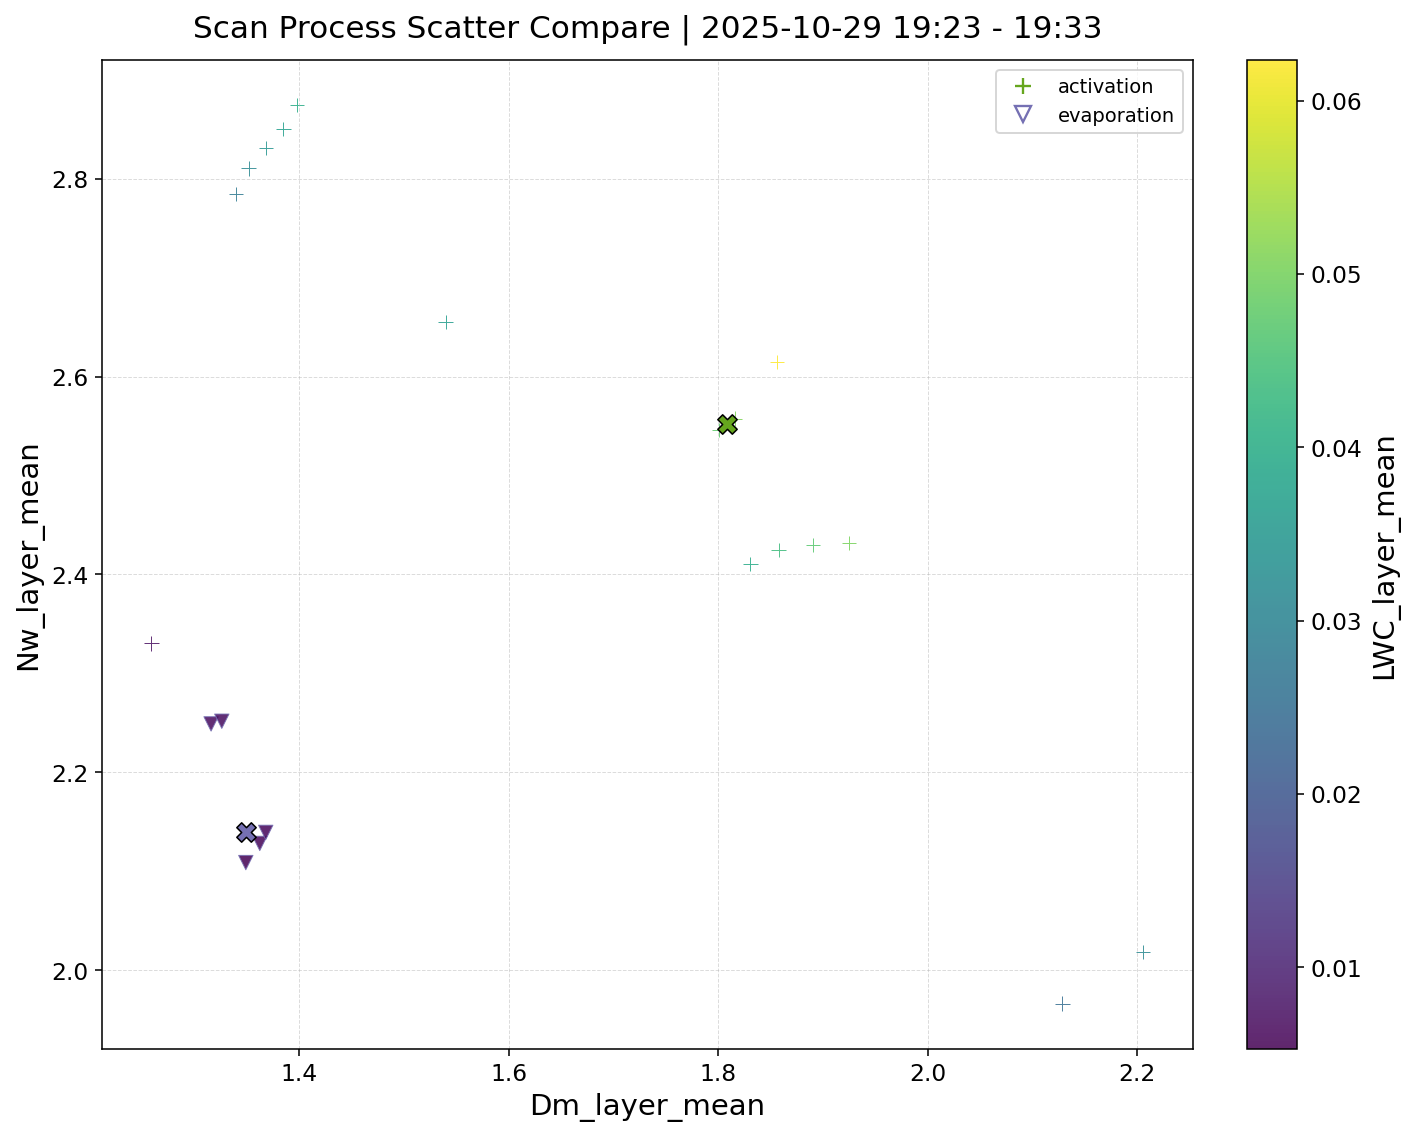
plot_fused_process_quicklook()Quicklook overlay of fused vertical process events on scan context.
uv run python scripts/build_plot_examples.py --only plot-fused-quicklook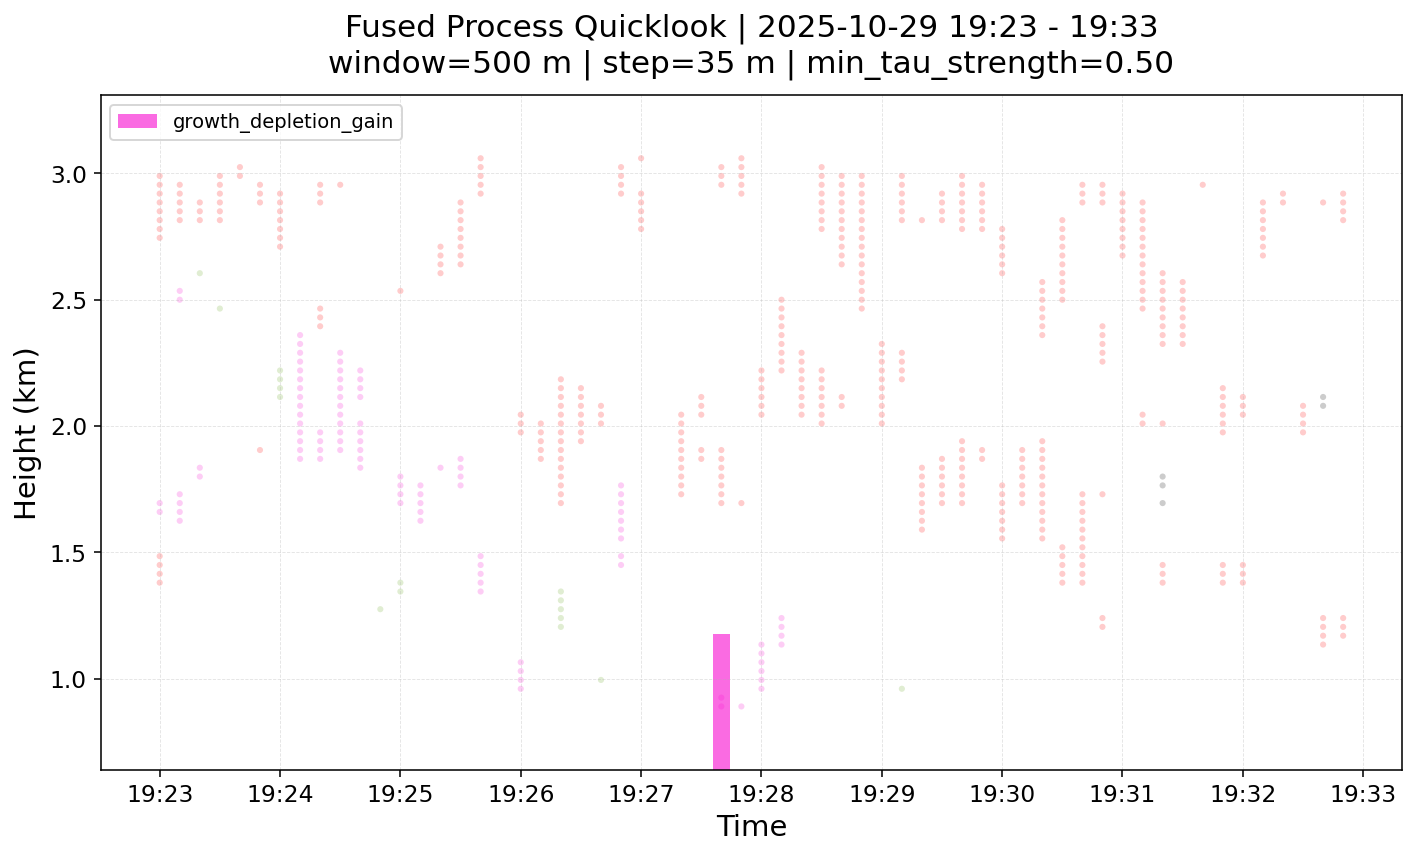
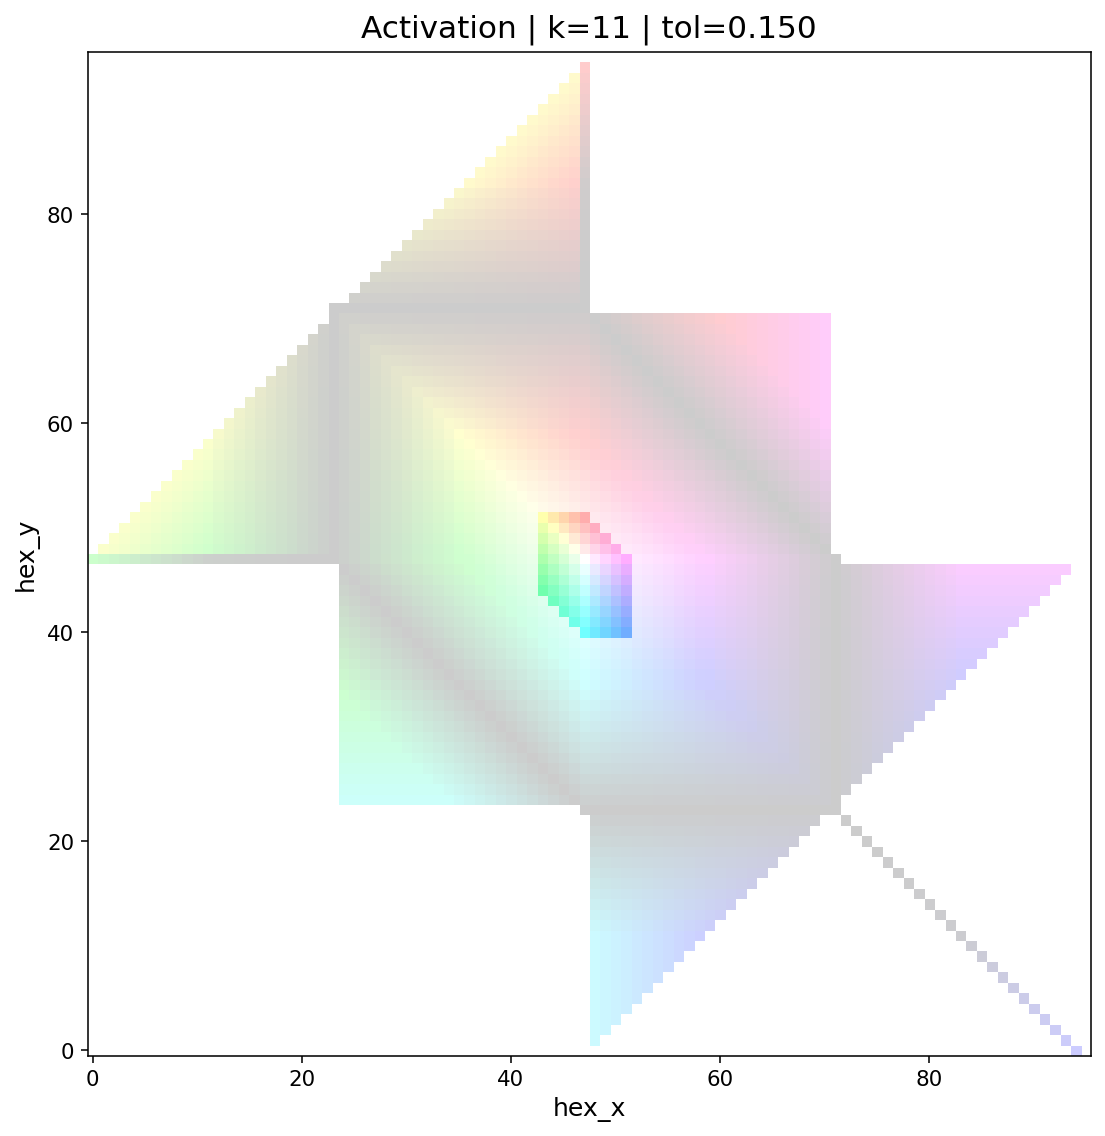
plot_process_to_hexagram()Theoretical RGB hexagram mask for one rain-process signature.
uv run python scripts/build_plot_examples.py --only plot-hexagram-process